


Connect Sensor Data to 3D Models
Overview
For more than 20 years, NI LabVIEW software has made it easy for engineers and scientists to create user interfaces and
displays using 2D charts and graphs. LabVIEW 8.6 introduces a new concept for data visualization: 3D sensor mapping.
You can now easily incorporate CAD models into the LabVIEW environment to better show how acquired data
corresponds to the device under test.
Visualize DAQ Channel Data on 3D Models
With the LabVIEW 3D Sensor Mapping Express VI, you can import a user-defined CAD model (VRML or STL file) into
LabVIEW, assign actual data acquisition channels or simulated sensors, and display that model on the LabVIEW front
panel. This new feature is ideal for visualizing data in high-channel-count applications where distinguishing between
many channels on a graph is difficult. Being able to distinguish the output of individual sensors on a model also makes
troubleshooting erroneous sensors easier, thus increasing test efficiency. Finally, by using the same model in production
design, and test, different development teams can better communicate expected results with actual data.
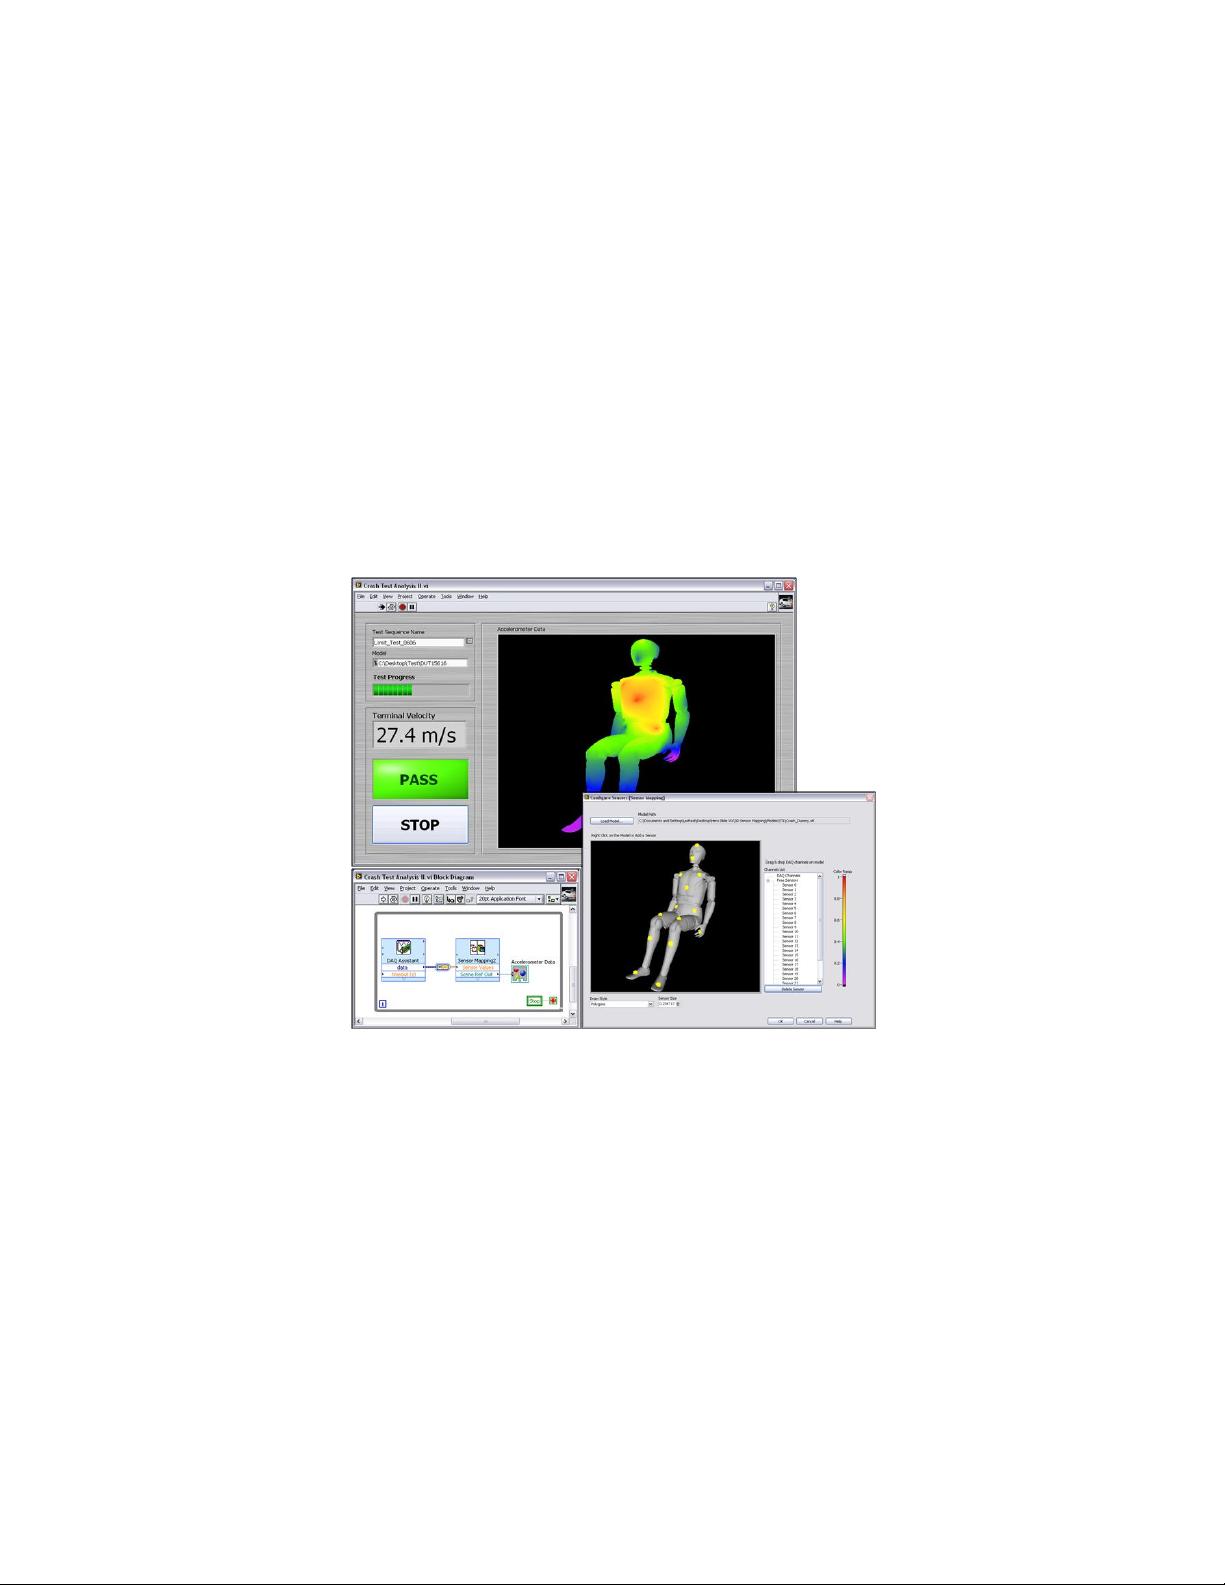
Figure 1. LabVIEW 3D Sensor Mapping Express VI
Using the 3D Sensor Mapping Express VI
Navigate to the 3D Sensor Mapping Express VI in the Functions Palette at Functions>>Graphics & Sound>>3D Picture
Control>>Helpers>>Sensor Mapping.


评论0