


Application Note No. L.A.B. 303B
Constellation Displays
Analyze Data Communications Signals Using X-Y Displays
Constellation diagrams are
commonly used in analyzing
the performance of data
communications systems us-
ing quadrature signal genera-
tion techniques to phase en-
code digital data. The con-
stellation diagram is an X-Y
display which shows the data
states of phase or phase-
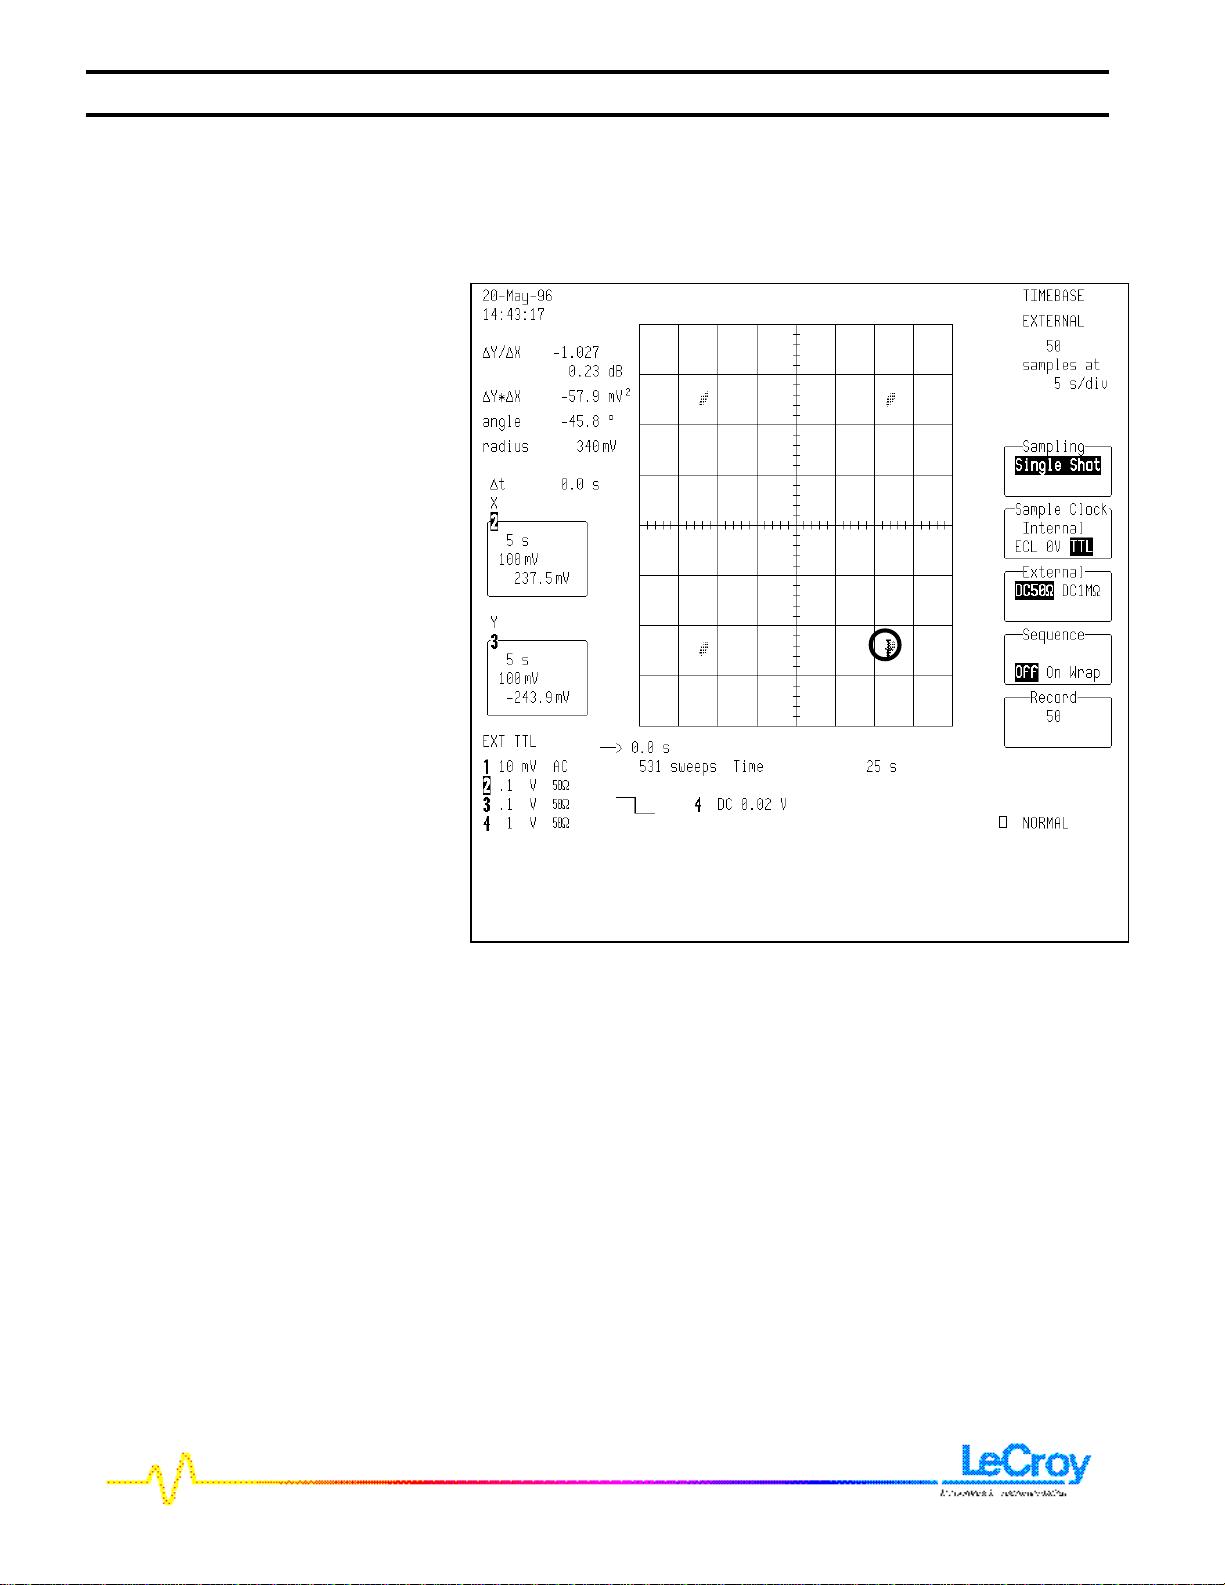
amplitude encoded data. Fig-
ure 1 shows a constellation
diagram for a quad state phase
shift keyed (QPSK) signals.
There are 4 data states associ-
ated with each transmitted
symbol encoded as 45
o
, 135
o
,
-45
o
, and -135
o
.
The constellation diagram re-
quires an oscilloscope with X-
Y displays, external sampling
clock, and a persistence dis-
play, all of which are avail-
able in the LeCroy 9300 series
oscilloscopes. In addition to
the standard 100 MHz exter-
nal sampling input the 93XX-
CKTRIG option extends ex-
ternal clocking to 500 MHz.
As can be seen from the
TIMEBASE menu in figure 1
the oscilloscope accepts 3 dif-
ferent external clock signal
levels. The external clock
accepts ECL (-1.3V) , TTL
(+1.5V) or the zero crossing
of an analog signal as an in-
put. Triggering occurs on the
on the rising edge of the sig-
nal. The transition times of
the external clock signal
should be less than 10 ms.
The input impedance level
can also be set to 50Ω or 1
MΩ.
In external sampling the os-
cilloscope time base is set by
the user in terms of the total
number of samples set in the
RECORD field of the
TIMEBASE menu. This is
also shown in figure 1. Rec-
ord lengths of from 50 to the
maximum memory length (2
M in L versions) can be se-
lected in multiples of 1, 2, or
5. It is important to note
that the oscilloscope will
automatically revert to inter-
nal sampling if the TIME/DIV
knob is used.
X-Y cursors in LeCroy oscil-
loscopes read both the X and
Y voltage values and the re-
sultant output waveform
phase (angle) and magnitude
(radius). The X and Y volt-
ages are read in the trace an-
Figure 1-Constellation display of a 4 state QSPK signal . X-Y
cursors (circled) mark output at -45
o
and read both Carte-
sian(X-Y voltages) and polar (Phase/Radius) coordinates


评论0