0 1 2 3 4 5 6 7
-1
-0.8
-0.6
-0.4
-0.2
0
0.2
0.4
0.6
0.8
1
---> x
---> y
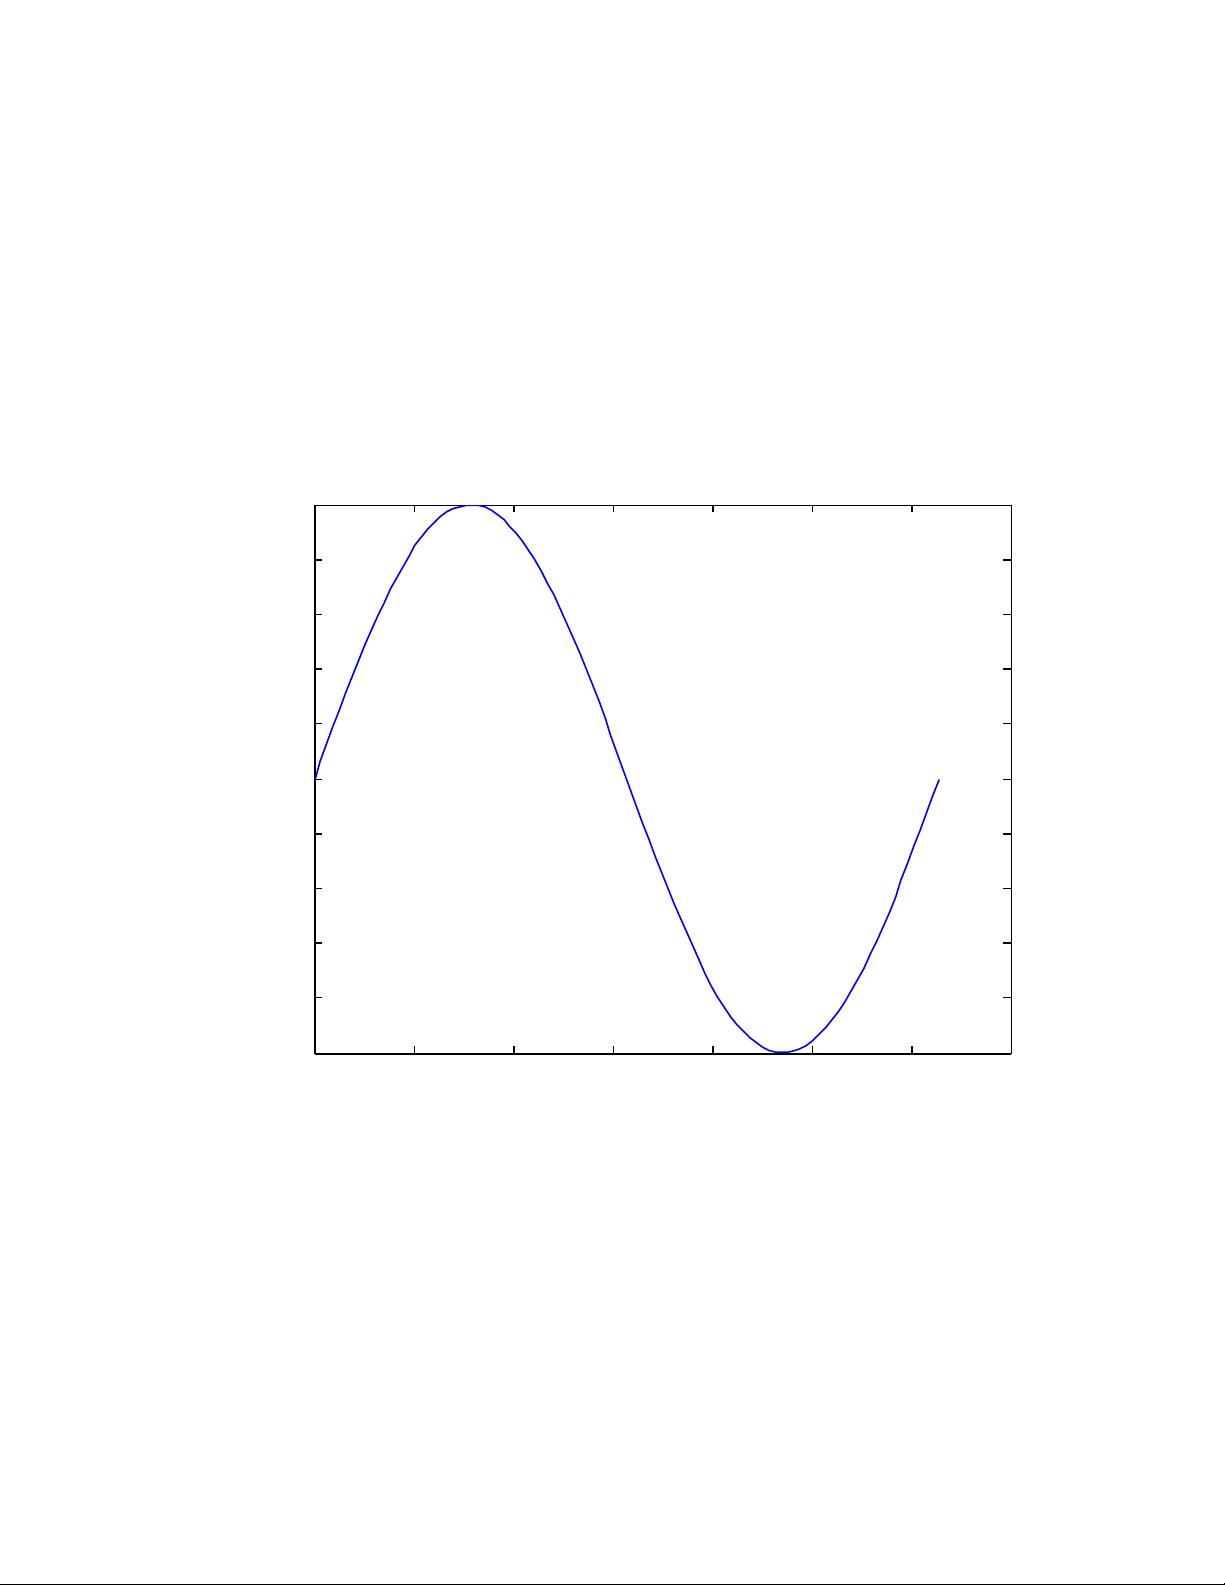
Sine Waveform
1- Plot y=sinx, 0<x<2π taking 100 linearly spaced points.
>> x=linspace(0,2*pi);
>> y=sin(x);
>> plot(x,y)
>> xlabel('---> x')
>> ylabel('---> y')
>> title('Sine Waveform')