没有合适的资源?快使用搜索试试~ 我知道了~
SGP30甲醛二氧化碳传感器
5星 · 超过95%的资源 需积分: 29 0 下载量 141 浏览量
2022-05-25
10:06:26
上传
评论
收藏 1.05MB PDF 举报
温馨提示
试读
15页
SGP30甲醛二氧化碳传感器
资源推荐
资源详情
资源评论
www.sensirion.com Version 0.9 – August 2017 1/15
Datasheet SGP30
Sensirion Gas Platform
Multi-pixel gas sensor for indoor air quality applications
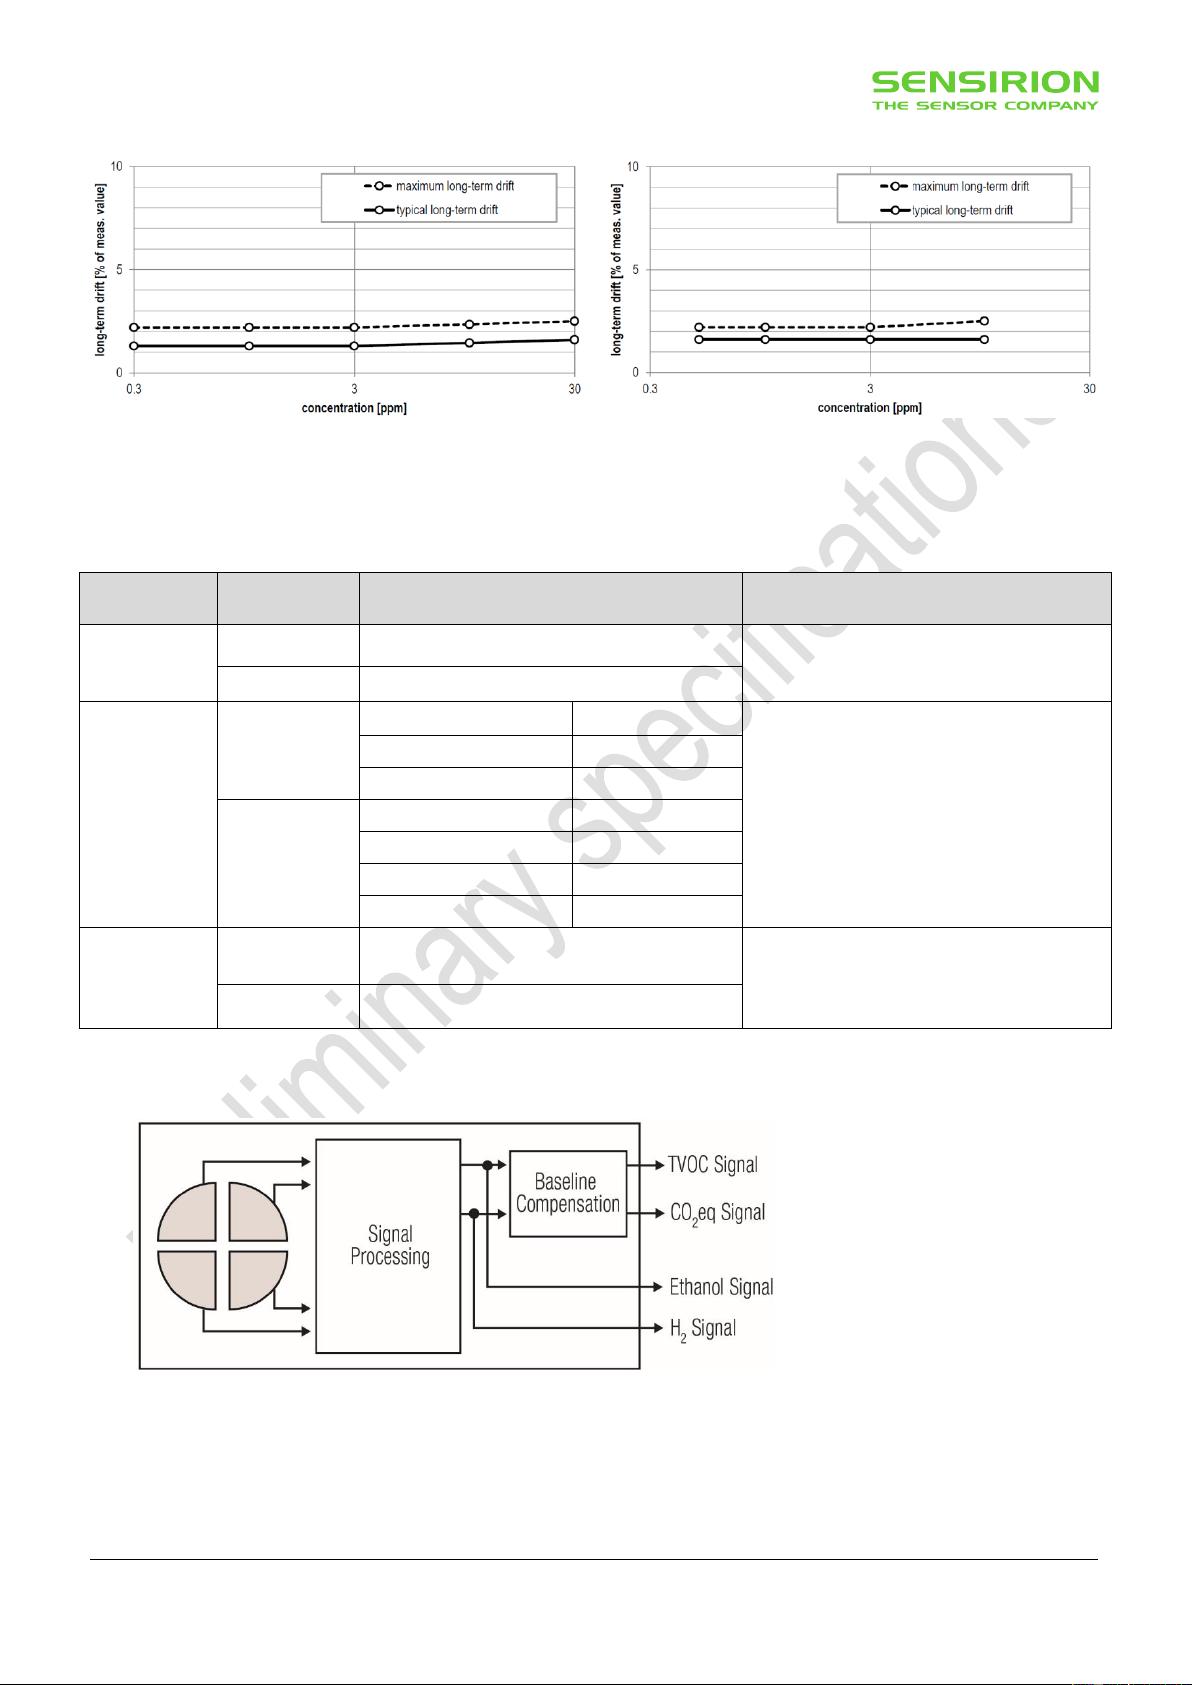
Outstanding long-term stability
I
2
C interface with TVOC and CO
2
eq output signals
Very small 6-pin DFN package: 2.45 x 2.45 x 0.9 mm
3
Low power consumption: 48 mA at 1.8V
Tape and reel packaged, reflow solderable
Block Diagram
Figure 1 Functional block diagram of the SGP30.
Product Summary
The SGP30 is a digital multi-pixel gas sensor designed for
easy integration into air purifier, demand-controlled
ventilation, and IoT applications. Sensirion’s CMOSens
®
technology offers a complete sensor system on a single
chip featuring a digital I
2
C interface, a temperature
controlled micro hotplate, and two preprocessed indoor air
quality signals. As the first metal-oxide gas sensor
featuring multiple sensing elements on one chip, the
SGP30 provides more detailed information about the air
quality.
The sensing element features an unmatched robustness
against contaminating gases present in real-world
applications enabling a unique long-term stability and low
drift. The very small 2.45 x 2.45 x 0.9 mm
3
DFN package
enables applications in limited spaces. Sensirion’s
state-of-the-art production process guarantees high
reproducibility and reliability. Tape and reel packaging,
together with suitability for standard SMD assembly
processes make the SGP30 predestined for high-volume
applications.
www.sensirion.com Version 0.9 – August 2017 2/15
1 Sensor Performance
1.1 Gas Sensing Performance
Parameter
Signal
Values
Comments
Measurement
range
1
Ethanol signal
0 ppm to 1000 ppm
H
2
signal
0 ppm to 1000 ppm
Specified
measurement
range
Ethanol signal
0.3 ppm to 30 ppm
The specifications below are defined for this measurement
range
2
. The specified measurement range covers the gas
concentrations expected in indoor air quality applications.
H
2
signal
0.5 ppm to 10 ppm
Accuracy
3
Ethanol signal
see Figure 2
typ.: 15% of meas. value
Accuracy of the concentration c
determined by
a = 512
s
out
: EthOH/H
2
signal output
at concentration c
s
ref
: EthOH/H
2
signal output
at 0.5 ppm H
2
c
ref
= 0.4 ppm
H
2
signal
see Figure 3
typ.: 10% of meas. value
c
ref
= 0.5 ppm
Long-term
drift
3,4
Ethanol signal
see Figure 4
typ.: 1.3% of meas. value
Change of accuracy over time: Siloxane accelerated lifetime
test
5
H
2
signal
see Figure 5
typ.: 1.3% of meas. value
Resolution
Ethanol signal
0.2 % of meas. value
Resolution of Ethanol and H
2
signal outputs in relative
change of the measured concentration
H
2
signal
Sampling
frequency
Ethanol signal
Max. 40 Hz
Compare with minimum measurement duration in Table 10
H
2
signal
Table 1 Gas sensing performance. Specifications are at 25°C, 50% RH and typical VDD.
Accuracy ethanol signal
Figure 2 Typical and maximum accuracy tolerance in % of
measured value at 25°C, 50% RH and typical VDD. The sensors
have been operated for at least 24h before the characterization.
Accuracy H
2
signal
Figure 3 Typical and maximum accuracy tolerance in % of
measured value at 25°C, 50% RH and typical VDD. The sensors
have been operated for at least 60h before the characterization.
1
Exposure to ethanol and H
2
concentrations up to 1000 ppm have been tested. For applications requiring the measurement of higher gas
concentrations please contact Sensirion.
2
ppm: parts per million. 1 ppm = 1000 ppb (parts per billion)
3
90% of the sensors will be within the typical accuracy tolerance, >99% are within the maximum tolerance.
4
The long-term drift is stated as change of accuracy per year of operation.
5
Test conditions: operation in 250 ppm Decamethylcyclopentasiloxane (D5) for 200h simulating 10 years of operation in an indoor
environment.
www.sensirion.com Version 0.9 – August 2017 3/15
Long-term drift Ethanol signal
Figure 4 Typical and maximum long-term drift in % of measured
value at 25°C, 50% RH and typical VDD. The sensors have been
operated for at least 24h before the first characterization.
Long-term drift H
2
signal
Figure 5 Typical and maximum long-term drift in % of measured
value at 25°C, 50% RH and typical VDD. The sensors have been
operated for at least 60h before the first characterization.
1.2 Air Quality Signals
Parameter
Signal
Values
Comments
Output range
TVOC signal
0 ppb to 60000 ppb
Maximum possible output range. The gas
sensing performance is specified for the
measurement range as defined in Table 1
CO
2
eq signal
400 ppm to 60000 ppm
Resolution
TVOC signal
0 ppb - 2008 ppb
1 ppb
2008 ppb – 11110 ppb
6 ppb
11110 ppb – 60000 ppb
32 ppb
CO
2
eq signal
400 ppm – 1479 ppm
1 ppm
1479 ppm – 5144 ppm
3 ppm
5144 ppm – 17597 ppm
9 ppm
17597 ppm – 60000 ppm
31 ppm
Sampling rate
TVOC signal
1 Hz
The on-chip baseline compensation algorithm
has been optimized for this sampling rate. The
sensor shows best performance when used
with this sampling rate.
CO
2
eq signal
1 Hz
Table 2 Air quality signal specifications.
Figure 6 Simplified version of the functional block diagram (compare Figure 1) showing the signal
paths of the SGP30.
1.3 Recommended Operating Conditions
The sensor shows best performance when operated within recommended normal temperature and humidity range of
5 – 55 °C and 4 –20 g/m
3
, respectively. Long-term exposure (operated and not operated) to conditions outside the
剩余14页未读,继续阅读
wangenliang1
- 粉丝: 0
- 资源: 18
上传资源 快速赚钱
- 我的内容管理 展开
- 我的资源 快来上传第一个资源
- 我的收益 登录查看自己的收益
- 我的积分 登录查看自己的积分
- 我的C币 登录后查看C币余额
- 我的收藏
- 我的下载
- 下载帮助
安全验证
文档复制为VIP权益,开通VIP直接复制
信息提交成功
- 1
- 2
前往页