[](https://badge.fury.io/py/PyALE)
[](https://travis-ci.org/DanaJomar/PyALE)
[](https://codecov.io/gh/DanaJomar/PyALE)
# PyALE
**ALE**: Accumulated Local Effects <br>
A python implementation of the ALE plots based on the implementation of the R package [ALEPlot](https://github.com/cran/ALEPlot/blob/master/R/ALEPlot.R)
## Installation:
Via pip `pip install PyALE`
## Features:
The end goal is to be able to create the ALE plots whether was the feature numeric or categorical.
### For numeric features:
The package offers the possibility to
* Compute and plot the effect of one numeric feature (1D ALE)
* including the option to compute a confidence interval of the effect.
* Compute and plot the effect of two numeric features (2D ALE)
### For categorical features:
Since python models work with numeric features only, categorical variables are often encoded by one of two methods, either with integer encoding (when the categories have a natural ordering of some sort e.g., days of the week) or with one-hot-encoding (when the categories do not have ordering e.g., colors). The package offers the option to compute and plot the effect of such features, including the option to compute a confidence interval of the effect. In this case the use has two options:
* For integer encoding: the user can plot the effect of the feature as a discrete feature
* does not need additional preparation steps
* For one-hot-encoding: or any other custom encoding, the package, starting from version 1.1, offers the possibility to pass a custom encoding function to categorical (or string) features.
* in this case the user must provide
* a function that encodes the raw feature
* a data set that includes the raw feature instead of the encoded one (including all other features used for training)
* a list of all predictors used for training the model
The package by default uses the ordering assigned to the given categorical feature, however, if the feature does not have an assigned ordering, then the categories of the feature will be ordered by their similarities based on the distribution of the other features in each category.
## Usage with examples:
* First prepare the data and train a model.
* To explore the different features in this package, we choose one categorical feature to one-hot-encode, and we'll use integer encoding for the rest.
* Full code and other examples can be found in [Examples](https://htmlpreview.github.io/?https://github.com/DanaJomar/PyALE/blob/master/examples/Examples.html)
* For the following examples we train a random forest to predict the price of diamonds with the following data
```python
X[features]
```
| carat | cut_code | clarity_code | depth | table | x | y | z | D | E | F | G | H | I | J |
| ----- | -------- | ------------ | ----- | ----- | ---- | ---- | ---- | ---- | ---- | ---- | ---- | ---- | ---- | ---- |
| 0.23 | 4 | 1 | 61.5 | 55.0 | 3.95 | 3.98 | 2.43 | 0.0 | 1.0 | 0.0 | 0.0 | 0.0 | 0.0 | 0.0 |
| 0.21 | 3 | 2 | 59.8 | 61.0 | 3.89 | 3.84 | 2.31 | 0.0 | 1.0 | 0.0 | 0.0 | 0.0 | 0.0 | 0.0 |
| 0.23 | 1 | 4 | 56.9 | 65.0 | 4.05 | 4.07 | 2.31 | 0.0 | 1.0 | 0.0 | 0.0 | 0.0 | 0.0 | 0.0 |
| 0.29 | 3 | 3 | 62.4 | 58.0 | 4.20 | 4.23 | 2.63 | 0.0 | 0.0 | 0.0 | 0.0 | 0.0 | 1.0 | 0.0 |
| 0.31 | 1 | 1 | 63.3 | 58.0 | 4.34 | 4.35 | 2.75 | 0.0 | 0.0 | 0.0 | 0.0 | 0.0 | 0.0 | 1.0 |
* import the generic function `ale` from the package
```python
from PyALE import ale
```
* start analysing the effects of your features
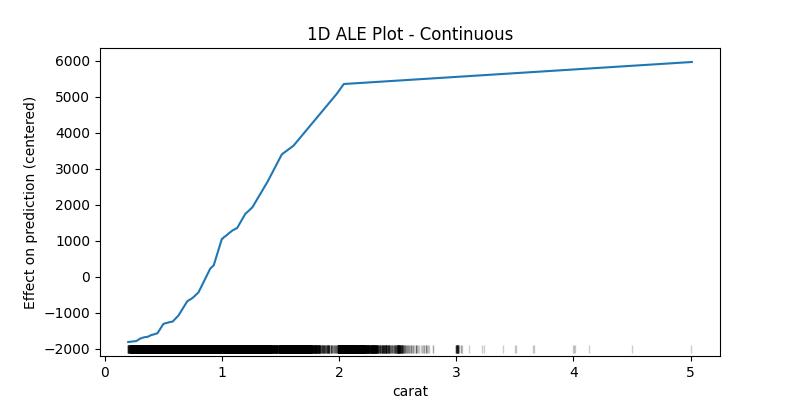
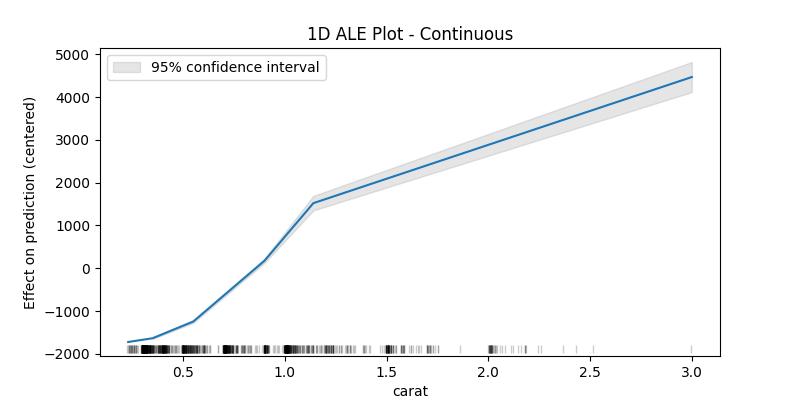
* **1D ALE plot for numeric continuous feature**
```python
## 1D - continuous - no CI
ale_eff = ale(
X=X[features], model=model, feature=["carat"], grid_size=50, include_CI=False
)
```
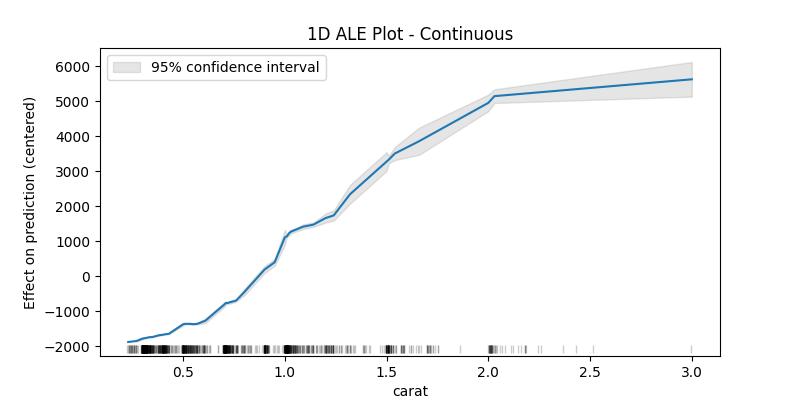
The confidence intervals around the estimated effects are specially important when the sample data is small, which is why as an example plot for the confidence intervals we'll take a random sample of the dataset
```python
## 1D - continuous - with 95% CI
random.seed(123)
X_sample = X[features].loc[random.sample(X.index.to_list(), 1000), :]
ale_eff = ale(
X=X_sample, model=model, feature=["carat"], grid_size=50, include_CI=True, C=0.95
)
```
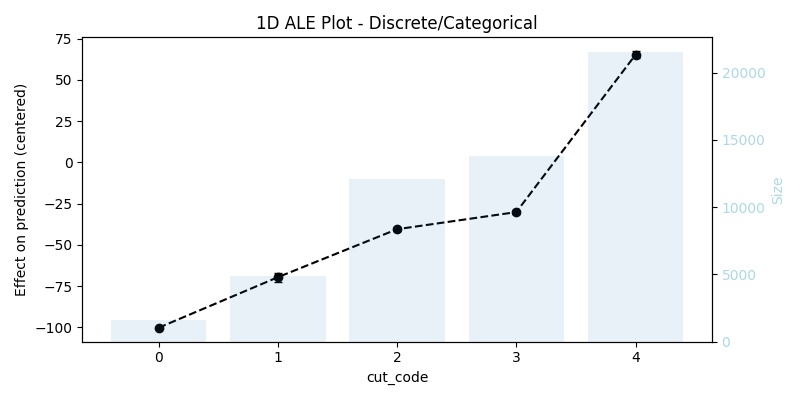
* **1D ALE plot for numeric discrete feature**
```python
## 1D - discrete
ale_eff = ale(X=X[features], model=model, feature=["cut_code"])
```
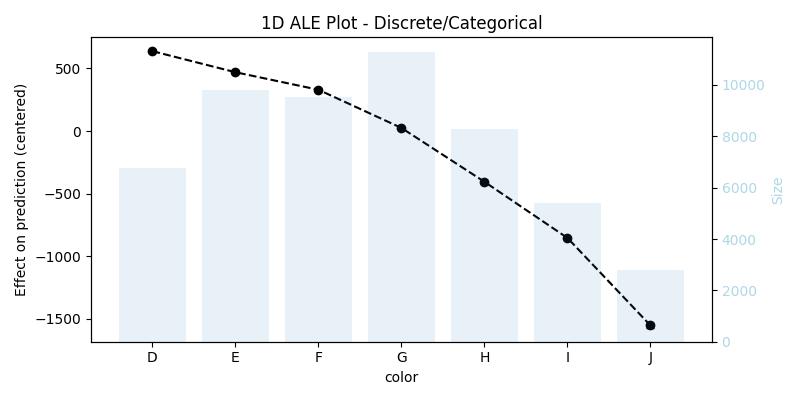
* **1D ALE plot for [one-hot-encoded] categorical feature**
In this case, it is not enough to use `X[features]` (that was used for training), because it does not contain the original feature, we have to replace the encoding with the raw feature, and then we need to pass a custom encoding function (in our example the function`onehot_encode`) and a list or array of all used predictors (in our example the list `features`)
```python
## remove the one-hot-encoding columns and add the original -raw- feature
## since X already has the raw feature it is enough to drop its encoding columns
X_feat_raw = X.drop(coded_feature.columns.to_list(), axis=1, inplace=False).copy()
## 1D - categorical
ale_eff = ale(
X=X_feat_raw,
model=model,
feature=["color"],
encode_fun=onehot_encode,
predictors=features,
)
```
Note that the function `ale` has detected the right feature type in all three cases, however, the user can always specify the feature type if she/he thinks that the function did not detect the expected type.
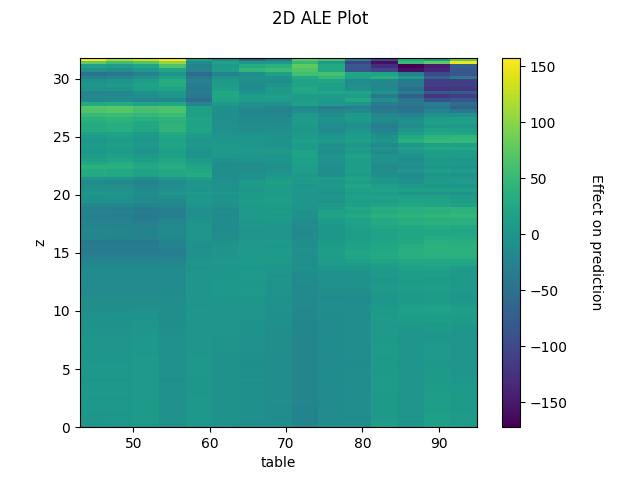
* **2D ALE plot for numeric features**
```python
## 2D - continuous
ale_eff = ale(X=X[features], model=model, feature=["z", "table"], grid_size=100)
```
## Interpretation:
```python
random.seed(123)
X_sample = X[features].loc[random.sample(X.index.to_list(), 1000), :]
ale_contin = ale(
X=X_sample,
model=model,
feature=["carat"],
feature_type="continuous",
grid_size=5,
include_CI=True,
C=0.95,
)
```
For continuous variables the algorithm cuts the feature to bins starting from the minimum value and ending with the maximum value of the feature, then computes the average difference in prediction when the value of the feature moves between the edges of each bin, finally returns the centered cumulative sum of these averages (and the confidence interval of the differences - optional).
```python
ale_contin
```
| carat | eff | size | lowerCI_95% | upperCI_95% |
| ------ | ----------- | ------ | ----------- | ----------- |
| 0.23 |-1721.408141 | 0.0 | NaN | NaN |
| 0.35 |-1633.405685 | 203.0 | -1650.042600 | -1616.768770 |
| 0.55 |-1242.989786 | 204.0 | -1275.489577 | -1210.489995 |
| 0.90 | 176.838662 | 213.0 | 125.162929 | 228.514394 |
| 1.14 | 1521.617690 | 182.0 | 1351.287932 | 1691.947448 |
| 3.00 | 4467.185422 | 198.0 | 4115.599415 | 4818.
Python库 | PyALE-1.1.0.tar.gz
版权申诉

 PyALE-1.1.0.tar.gz (20个子文件)
  PyALE-1.1.0
  PKG-INFO 14KB PyALE.egg-info PKG-INFO 14KB
 requires.txt 66B SOURCES.txt 381B top_level.txt 12B dependency_links.txt 1B tests test_lib.py 2KB test_ale.py 10KB test_2D_ale.py 4KB test_1D_ale.py 18KB __init__.py 0B setup.cfg 38B PyALE _ALE_generic.py 10KB _src ALE_1D.py 16KB lib.py 6KB ALE_2D.py 9KB __init__.py 0B __init__.py 30B setup.py 872B README.md 12KB
资源评论

 HotelCalifornia6592023-08-27资源内容详细全面,与描述一致,对我很有用,有一定的使用价值。
 锻铁成钢22022-10-28发现一个宝藏资源,资源有很高的参考价值,赶紧学起来~

挣扎的蓝藻
- 粉丝: 13w+
- 资源: 15万+


最新资源
- Python毕业设计基于Django的网易云数据分析可视化大屏系统的设计与实现+使用说明+全部资料(优秀项目).zip
- Python毕业设计基于Django的网易云数据分析可视化大屏系统的设计与实现+使用说明+全部资料(高分项目).zip
- JavaScript实现的鼠标手势
- 人工兔优化算法ARO MATLAB源码, 应用案例为函数极值求解以及优化svm进行分类,代码注释详细,可结合自身需求进行应用
- 人才网站设计-asp.net+sql-(系统源码)
- asp.net+sql人才网站设计-含系统源码
- C#应用的用户配置窗体方案
- python实现绘制爱心图形的代码
- JAVAWEB项目-校园订餐系统项目源码.zip
- flink-1.19.0-bin-scala-2.12.tgz flink-1.16.3-bin-scala-2.12.tgz
资源上传下载、课程学习等过程中有任何疑问或建议,欢迎提出宝贵意见哦~我们会及时处理!
点击此处反馈


