没有合适的资源?快使用搜索试试~ 我知道了~
采用高斯贝叶斯,强化学习等算法,模型创新性强,作图使用了ppt等软件
资源推荐
资源详情
资源评论
Problem Chosen
C
2023
MCM/ICM
Summary Sheet
Team Control Number
2313336
Exploring the mysterious distribution out of
the five-letter Wordle game
Summary
In the past year, the five-letter puzzle grid known as Wordle has rapidly gone from being
a popular American puzzle to a global craze. Solving the Wordle problem requires not only a
rich vocabulary but also sophisticated strategies and wisdom. In this paper, we establish a
series of models to predict the number and the distribution of Wordle results.
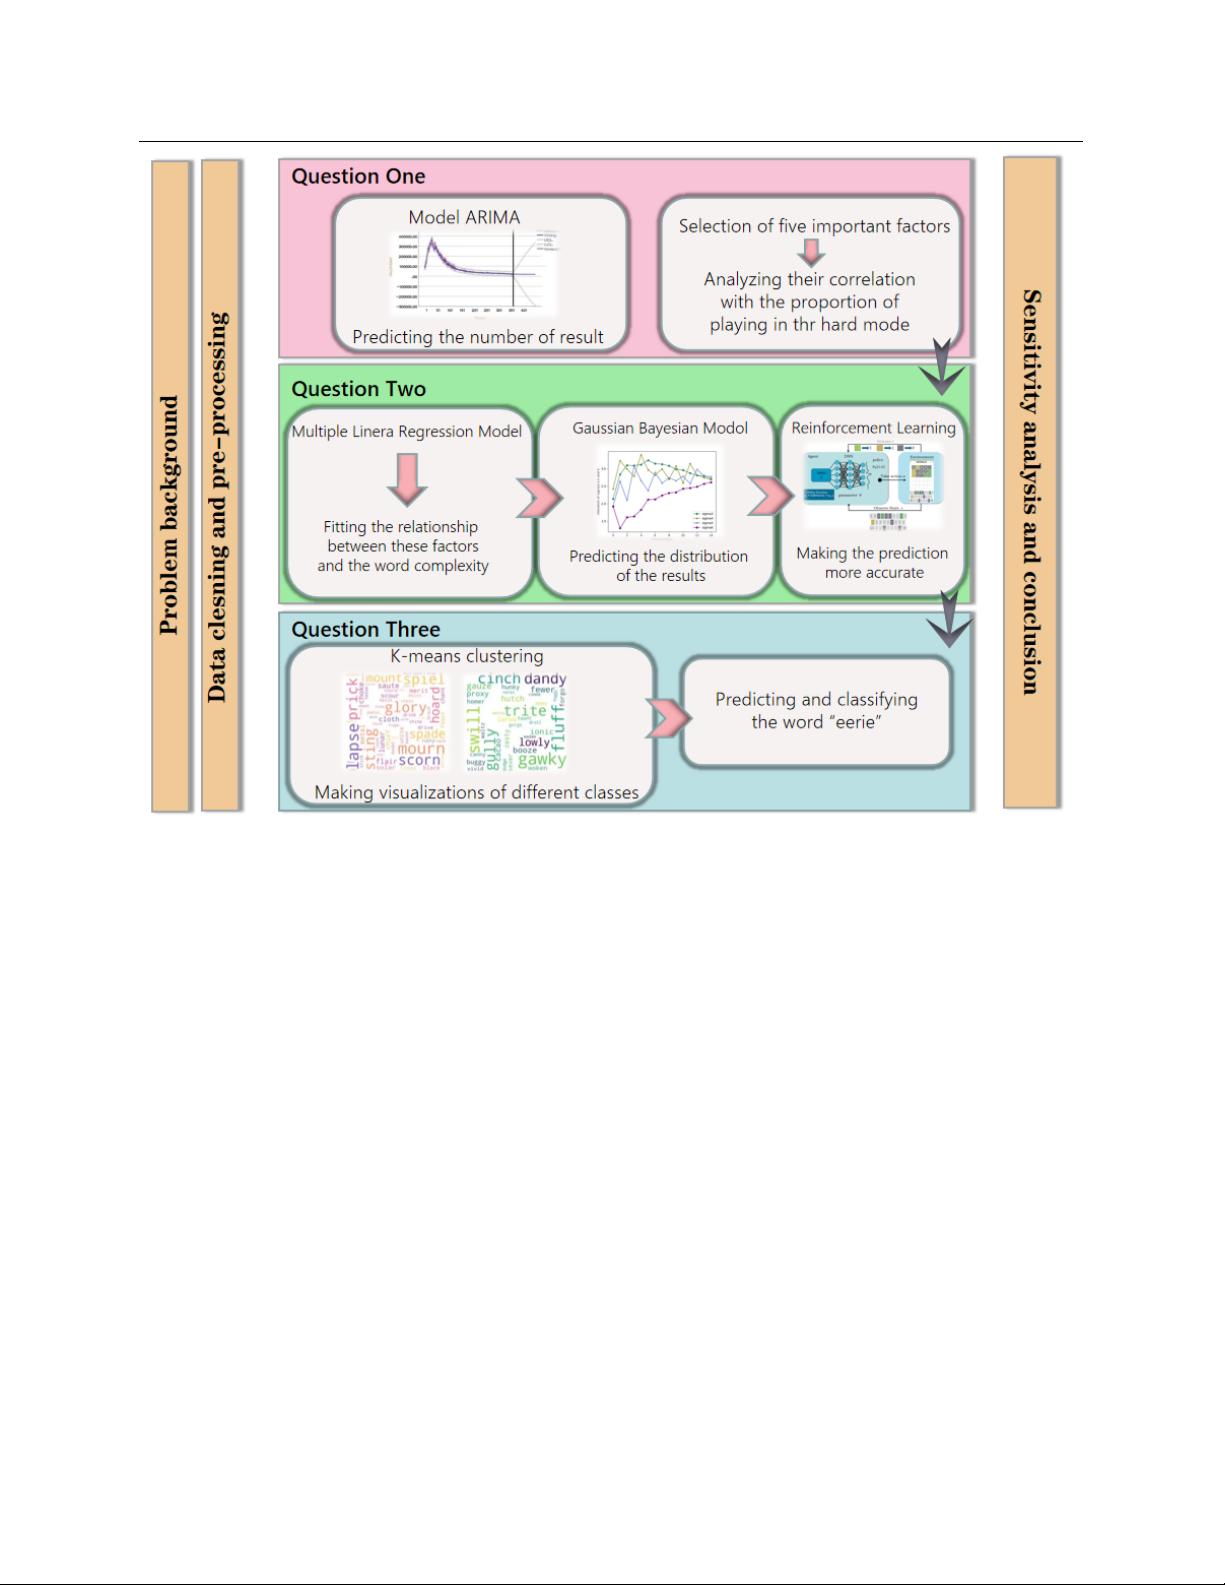
For Problem 1, to solve the prediction range of the number of reported results, we
analyze the correlation between the total number of players and time in the given table and
use the time series model ARIMA (1,1,0) to describe the changing trend. We analyze the
rationality of the fitting curve and give the prediction range of the number of people on March
1, 2023, which is about 19114 to 19118. To figure out the influence of word factors on the
proportion of difficult mode selection, we choose five important factors related to the
difficulty of words and take 0.05 as the dividing line to analyze the influencing factors. We
can find that these factors do not influence the proportion of difficult mode selection.
For Problem 2, We first established a Multiple Linear Regression model based on five
factors we assumed in Problem 1, and on this basis, we establish the model of Gaussian
Bayesian, in which
,
are four essential factors. While the first three elements are
all given by analyzing the existing data, we regard
as parameters that need training.
Through our algorithm, we find the proper
and preliminarily fitted model. For more
accurate prediction, we introduce Reinforcement Learning, whose advantage is to simulate
the players adjusting their strategies according to the feedback. We define the elements of
reinforcement learning and use a neural network to simulate the strategies. Finally, we
combine the two models and make the prediction of the distribution of the word ‘eerie’,
which is [0.0018,0.0386,0.2498,0.3369,0.2316,0.1128,0.0275] and the average absolute
error is not more than 0.012.
For Problem 3, we introduced the K-Means clustering algorithm to grade the difficulty
of words. We set each word's x and y coordinates as Multiple Linear Regression prediction
results and the average number of steps to complete the goal in Reinforcement Learning. We
set the total number of categories to 5, the larger the number, the more difficult the guess is.
After that, we execute the clustering algorithm and get the specific division of each category.
We use the model to evaluate the word 'eerie'. The result of which belongs to the 5th category
and the accuracy is 92.6%.
Finally, we find some interesting features in the dataset and make a sensitivity analysis
of our model. We calculated that our model has strong accuracy under a wide change of
initialization from -20% to +40% with an average absolute error of 4.4%, which illustrates
that our model has high accuracy and error tolerance.
Keywords: ARIMA, Multiple Linear Regression model, Gaussian Bayesian,
Reinforcement Learning, K-Means clustering algorithm
Team # 2313336 Page 2 of 25
Contents
1 Introduction ............................................................................................................................... 3
1.1 Problem Background......................................................................................................... 3
1.2 Restatement of the Problem............................................................................................... 3
1.3 Our work .......................................................................................................................... 4
2 Assumptions and Justifications ................................................................................................. 5
3 Notations .................................................................................................................................... 6
4 Data Cleaning and Preprocessing ............................................................................................. 6
5 Problem 1: ARIMA Model and selection of important factors ............................................... 6
5.1 Overview of using ARIMA model .................................................................................... 6
5.1.1 Time series model .................................................................................................. 6
5.1.2 The creation and analysis of time series .................................................................. 8
5.2 The influence factors of word attributes........................................................................... 11
6 Model II: Gaussian-Bayesian Model And Reinforcement Learning...................................... 12
6.1 Gaussian-Bayesian Model ............................................................................................... 12
6.2 Gaussian-Bayesian Model ............................................................................................... 13
6.3 Reinforcement Learning .................................................................................................. 14
7 Model III: K-Means Model ..................................................................................................... 17
8 Other interesting features ....................................................................................................... 19
9 Sensitivity Analysis .................................................................................................................. 20
10 Conclusion ............................................................................................................................. 21
10.1 Strengths and Weaknesses ............................................................................................. 21
10.2 Future improvement: .................................................................................................. 21
A letter to the Puzzle Editor ....................................................................................................... 22
References................................................................................................................................... 24
Appendix .................................................................................................................................... 25
Team # 2313336 Page 3 of 25
1 Introduction
1.1 Problem Background
One of the most popular tweets on the Internet these days was only consists of red, green
and grey emoji squares, accompanied by a few words of either excitement or frustration.
Don't worry, it's not a cult code or an alien script. In fact, this is just a "daily record" of Wordle,
a web-based game.
Wordle is a kind of crossword game, which is updated every day. The goal of the player
is to guess a five-letter word in six attempts. To do this, the game interface gives a 5 x 6 square
array. After the player enters the guess results through the keyboard , the game will color the
letter square, indicating the accuracy of the guess. The player then uses the cue to continue
trying until he guesses the answer correctly, or runs out of six chances.
Figure 1: Interface and Comments of the game
1.2 Restatement of the Problem
Based on scores reported by users on Twitter, MCM generated a file of daily results from
Jan. 7, 2022, to Dec. 31, 2022. The file includes the date, the match number, the word of the
day, the number of people who reported their score that day, the number of players in hard
mode, and the percentage that guessed the word.
By processing and analyzing the data in the file, we try to establish the corresponding
model to solve the following problems:
⚫ Develop a model to analyze and explain the changes in the number of reports over
time and establish a forecast interval for the number of reported outcomes by March
1, 2023. We will also explore how the attributes of words affect the percentage of
reported scores played in hard mode.
Team # 2313336 Page 4 of 25
⚫ For a given future solution word on a future date, set up a model to predict the
distribution of the future report results, and evaluate the model. Using a specific
example of the prediction for the word EERIE on March 1, 2023, show the results of
the prediction.
⚫ Develop and summarize a model to solve words by difficulty classification.
Determine the attributes of a given word associated with each classification. Discuss
how difficult it is to judge the word EERIE using this model and the accuracy of this
classification model.
⚫ Find other interesting features of this data set, try to list and describe them.
Finally, we will summarize the results with a one to two page letter to the New York
Times puzzle editor.
1.3 Our work
This paper proposes the model to predict the number and distribution of reported
results at a certain time in the future, which can be divided into three parts. At the very
beginning, we clean and preprocess the data.
Firstly, we establish the ARIMA model to predict the number of reported results,
and we selected five important factors that affect the difficulty of guessing words
and analyzed their correlation with the proportion of participating in the hard mode.
Secondly, we establish Multiple Linear Regression model to fit the relationship
between these factors and word complexity. On this basis we establish a Gaussian
Bayesian model to predict the distribution of the reported results and add
Reinforcement Learning to make the predicted results of our model more accurate.
Thirdly, we carry out K-means clustering based on the prediction results of the first
two questions, classify the words based on their difficulty and make the prediction
of the word ‘eerie’.
Finally, we make sensitivity analysis and list some other interesting features.
Our work is shown in Figure 2, in which you can have a general understanding of our
work .
Team # 2313336 Page 5 of 25
Figure 2: Model Overview
2 Assumptions and Justifications
To simplify our model and eliminate the complexity, we make the following main
assumptions in the literature, and each assumption is along with a reasonable justification.
All assumptions will be re-emphasized once they are used in our model.
➢ Assumptions 1: In the wordle game, we assume that for each class of trying times in the
dataset (1,2,3,4,5,6,7 or more), the continuous values of degree of difficulty associated
with each class are distributed according to a Gaussian distribution.
Justifications: When dealing with continuous data, a typical assumption is that
continuous values associated with each class are distributed according to a Gaussian
distribution. In this problem we can see the distribution of trying times in the middle(3
and 4) is significantly more than that on both sides(1 and 7 or more), and the overall
prior distribution also approximately conforms to the Gaussian prior distribution.
➢ Assumptions 2: For people playing in the hard mode, they are more advanced and they
are familiar with the words that may appear and rational enough to choose the best
words to guess. And they are smart enough to learn from the feedback of the game.
剩余24页未读,继续阅读
资源评论
m0_57819655
- 粉丝: 0
- 资源: 2
上传资源 快速赚钱
- 我的内容管理 展开
- 我的资源 快来上传第一个资源
- 我的收益 登录查看自己的收益
- 我的积分 登录查看自己的积分
- 我的C币 登录后查看C币余额
- 我的收藏
- 我的下载
- 下载帮助
安全验证
文档复制为VIP权益,开通VIP直接复制
信息提交成功