Detecting Novel Associations
in Large Data Sets
David N. Reshef,
1,2,3
*
† Yakir A. Reshef,
2,4
*
† Hilary K. Finucane,
5
Sharon R. Grossman,
2,6
Gilean McVean,
3,7
Peter J. Turnbaugh,
6
Eric S. Lander,
2,8,9
Michael Mitzenmacher,
10
‡ Pardis C. Sabeti
2,6
‡
Identifying interesting relationships between pairs of variables in large data sets is increasingly
important. Here, we present a measure of dependence for two-variable relationships: the maximal
information coefficient (MIC). MIC captures a wide range of associations both functional and
not, and for functional relationships provides a score that roughly equals the coefficient of
determination (R
2
) of the data relative to the regression function. MIC belongs to a larger
class of maximal information-based nonparametric exploration (MINE) statistics for identifying
and classifying relationships. We apply MIC and MINE to data sets in global health, gene
expression, major-league baseball, and the human gut microbiota and identify known and
novel relationships.
I
magine a data set with hundreds of variables,
which may contain important, undiscovered
relationships. There are tens of thousands of
variable pairs—far too many to examine manu-
ally . If you do not already know what kinds of
relationships to search for, how do you efficiently
identify the important ones? Data sets of this size
are increasingly common in fields as varied as
genomics, physics, political science, and econom-
ics, making this question an important and grow-
ing challenge (1, 2).
One way to begin exploring a large data set
is to search for pairs of variables that are closely
associated. T o do this, we could calculate some
measure of dependence for each pair, rank the
pairs by their scores, and examine the top-scorin g
pa ir s . Fo r this strategy to work, the statistic we
use to measure dependence should have two heu-
ristic properties: generality and equitability.
By generality, we mean that with sufficient
sample size the statistic should capture a wide
range of interesting associations, not limited to
specific function types (such as linear, exponential,
or periodic), or even to all functional relation-
ships (3). The latter condition is desirable because
not only do relationships take many functional
forms, but many important relationships—for ex-
ample, a superposition of functions—are not well
modeled by a function (4–7).
By equitability, w e mean that the statistic
should give similar scores to equally noisy rela-
tionships of different types. For example, we do
not want noisy linear relationships to drive strong
sinusoidal relationships from the top of the list.
Equitability is difficult to formalize for associa-
tions in general but has a clear interpretation in
the basic case of functional relationships: An equi-
table statistic should give similar scores to func-
tional relationships with similar R
2
values (given
sufficient sample size).
Here, we describe an exploratory data anal-
ysis tool, the maximal information coefficient
(MIC), that satisfies these two heuristic proper-
ties. W e establish MIC’s generality through proofs,
show its equitability on functional relationships
through simulations, and observe that this trans-
lates into intuitively equitable behavior on more
general associations. Furthermore, we illustrate
that MIC gives rise to a larger family of sta-
tistics, which we refer to as MINE, or maximal
information-based nonparametric exploration.
MINE statistics can be used not only to identify
interesting associations, but also to characterize
them according to properties such as nonline-
arity and monotonicity. We demonstrate the
application of MIC and MINE to data sets in
health, baseball, genomics, and the human
microbiota.
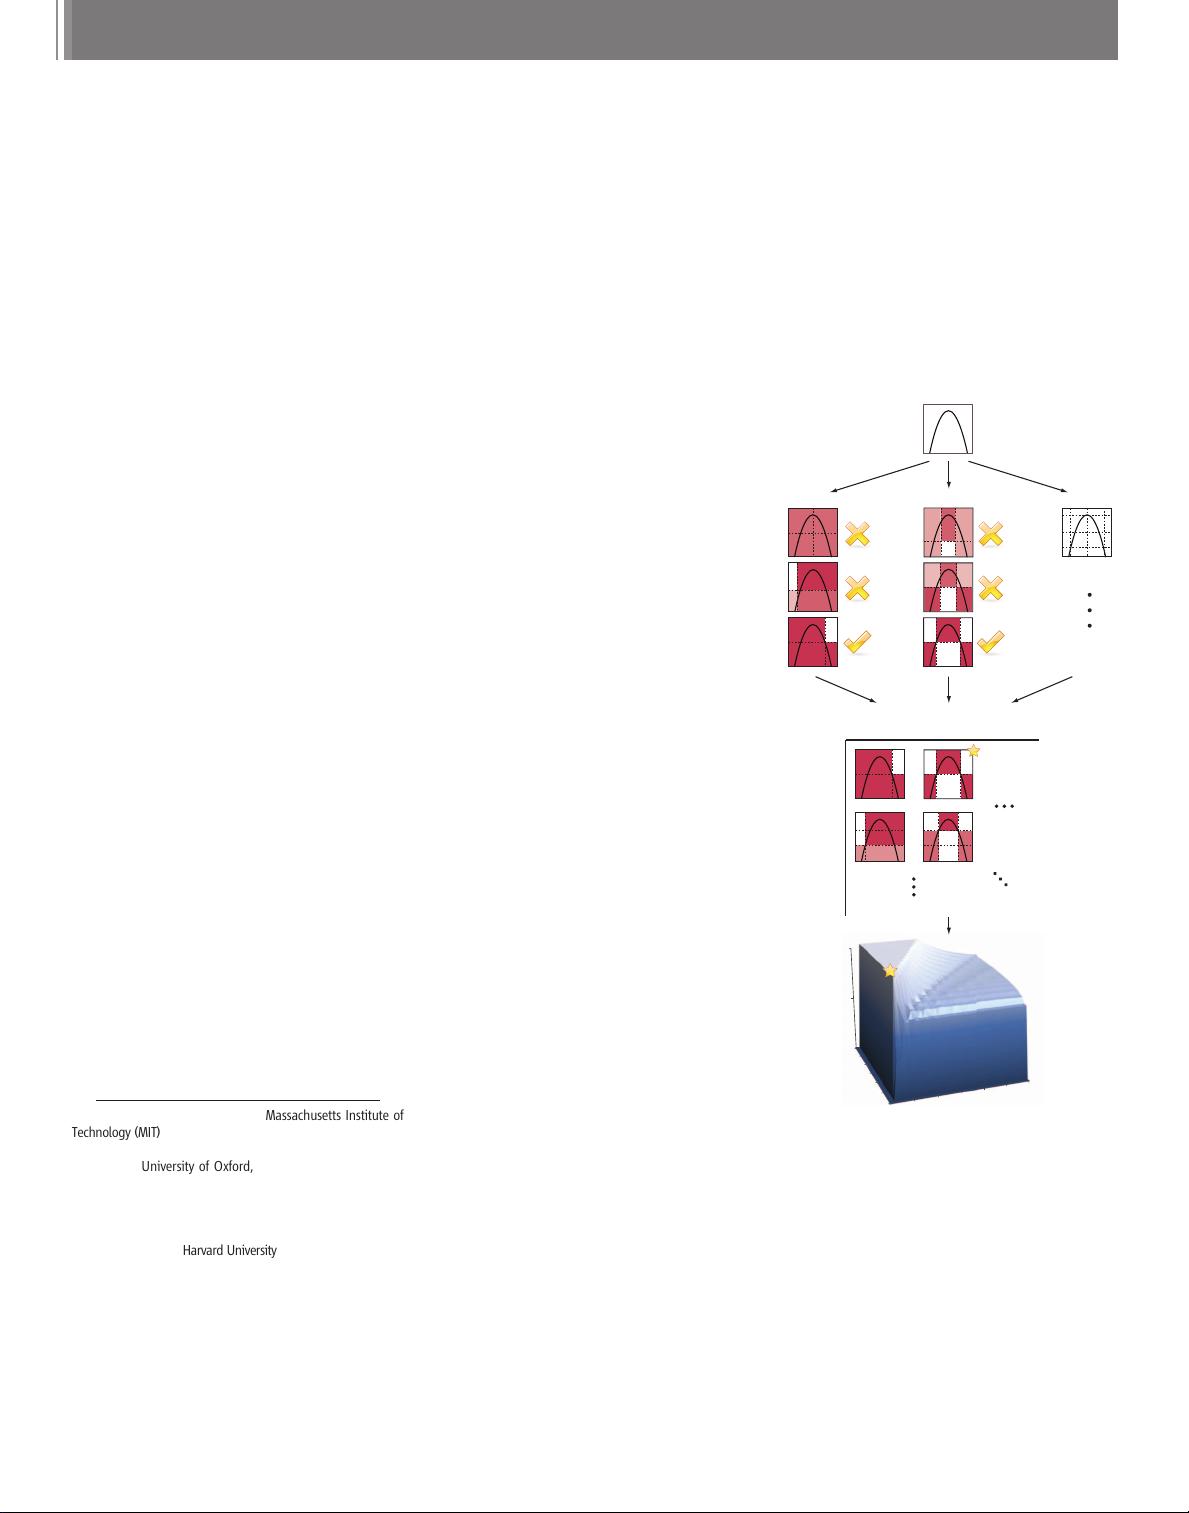
The maxi mal information coeffic ient. Intu-
itively, MIC is based on the idea that if a re-
lationship exists between two variables, then a
grid can be drawn on the scatterplot of the two
variables that partitions the data to encapsulate
that relationship. Thus, to calculate the MIC of a
set of two-variable data, we explore all grids up
to a maximal grid resolution, dependent on the
sample size (Fig. 1A), computing for every pair
of integers (x,y) the largest possible mutual in-
formation achievable by any x-by-y grid applied
to the data. We then normalize these mutual
information values to ensure a fair comparison
be twe en grids of different dimensions and to ob-
tain modified values between 0 and 1. We de-
fine the characteristic matrix M=(m
x,y
), where
m
x,y
is the highest normalized mutual infor-
mation achieved by any x-by-y grid, and the
statistic MIC to be the maximum value in M
(Fig. 1, B and C).
More formally, for a grid G, let I
G
denote
the mutual information of the probability dis-
1
Department of Computer Science, Massachusetts Institute of
Technology (MIT), Cambridge, MA 02139, USA.
2
Broad Institute
of MIT and Harvard, Cambridge, MA 02142, USA.
3
Department
of Statistics, University of Oxford, Oxford OX1 3TG, UK.
4
De-
partment of Mathematics, Harvard College, Cambridge, MA
02138, USA.
5
Department of Computer Science and Applied
Mathematics, Weizmann Institute of Science, Rehovot, Israel.
6
Center for Systems Biology, Department of Organismic and
Evolutionary Biology, Harvard University, Cambridge, MA 02138,
USA.
7
Wellcome Trust Centre for Human Genetics, University of
Oxford, Oxford OX3 7BN, UK.
8
Department of Biology, MIT,
Cambridge, MA 02139, USA.
9
Department of Systems Biology,
Harvard Medical School, Boston, MA 02115, USA.
10
School of
Engineering and Applied Sciences, Harvard University, Cam-
bridge, MA 02138, USA.
*These authors contributed equally to this work.
†To whom correspondence should be addressed. E-mail:
dnreshef@mit.edu (D.N.R.); yreshef@post.harvard.edu (Y.A.R.)
‡These authors contributed equally to this work.
Columns
Rows
32...
0
10
20
0
10
20
30
Normalized Score
Vertical Axis Bins
H
ori
z
o
n
tal Ax
is
Bi
ns
0.5
0.0
1.0
23...
2 x 2 2 x 3 x x y
A
B
C
Fig. 1. Computing MIC (A)Foreachpair(x,y), the
MIC algorithm finds the x-by-y grid with the highest
induced mutual information. (B)Thealgorithm
normalizes the mutual information scores and
compiles a matrix that stores, for each resolution,
thebestgridatthatresolutionanditsnormalized
score. (C) The normalized scores form the char-
acteristic matrix, which can be visualized as a sur-
face; MIC corresponds to the highest point on this
surface. In this example, there are many grids that
achieve the highest score. The star in (B) marks a
sample grid achieving this score, and the star in (C)
marks that grid’s corresponding location on the
surface.
RESEARCH ARTICLES
16 DECEMBER 2011 VOL 334 SCIENCE www.sciencemag.org1518
on December 15, 2011www.sciencemag.orgDownloaded from