


Diagramming for dummies
Abstract:
The structure of a simple diagramming control, called Netron Light, is
explained in some details. The control is a simplified version of the Netron
graph control which has many more features and with an overall more
complex architecture. This lightweight version contains however all the
core code to make graphs and flow-charts and can be used as a toy-model
for a more elaborate control or, if you wish, to help you understand the
full version.
Author:
Francois M.Vanderseypen,
Illumineo@users.sourceforge.net
The Netron Project, http://netron.sf.net
Monday, 10 January 2005
Diagramming for dummies
- 2 -

Diagramming for dummies
Introduction
Diagramming data can help you understand this data, look at it from a
different perspective and gain insight. Think of Microsoft’s BizTalk, Query
Analyzer, Data Transformation Services Designer and so on. Diagrams are
being used in many ways and for many things, from flow-charting to
programming, from network charting to real-time non-linear programming
in animations, from GSM technology to GPRS positioning, from simple
hierarchies to highly complex academic problems, graphs and diagrams
are everywhere. Over the past years topics like mind-mapping ([9]),
small-world phenomena (six degrees of freedom [10]) or ontologies (the
semantic web [8]) have become popular and are related to diagramming
and presenting data in effective, clear ways. On another level graphs are
being used to program and track bugs, either to clip away technicalities,
to maintain complexity to a certain level or because it simply allows a
bigger audience to develop things (cfr. The DTS designer in SQL Server,
for example).
Before .Net came along diagramming was solely reserved to the C++
community, it’s hard to imagine a simple way to write a diagramming
control in Visual Basic 6. In this .Net era it has become (almost) a piece of
cake to write a diagramming control. To demonstrate this statement the
following article introduces a simple control which allows you to create
interactive flow-charts and graphs. More precisely, it allows you to:
• create flow-charts; adding shapes and interactively connect them
(though it’s allowed to have freely floating connection, i.e.
unattached to a shape)
• extend with ease the collection of available shapes and connections
• change properties of the graph canvas and diagram object at run-
time by means of the usual property grid (aka ‘property browser’)
• learn how easy it is to develop GDI+ user-controls
The control does not contain, however, advanced features like:
• printing and saving diagrams (serialization)
• graph layout
• drag-and-drop
• scrolling or constraining diagrams
• grid and grid-snapping
• zoom-unzoom diagrams
• a document object model of the diagram
• selecting multiple diagram objects (the so-called ‘marching ants’
rectangle to select multiple objects)
Some of these features, like drag-and-drop or printing, are easy to
implement and you are encouraged to find out for yourself. Serialization
or graph layout algorithms are less evident. This control is, in fact, a
lightweight version of the Netron graph library ([1]). The Netron library
- 3 -

Diagramming for dummies
does contain the features listed above and much more. It allows you
among other things to:
• program with diagrams (the so-called visual programming
paradigm), see the Biotron application ([5]) for an example
• extend the control with shape and connection libraries via a
reflection mechanism
• analyze graphs with traditional algorithms, like the Kruskal
algorithm, Dijkstra or Depth-first algorithms
• create intelligent shapes with scripting or code generation
• develop applications like Microsoft’s Query analyzer, DTS designer
and so on
The Netron graph library is fully open source and this article aims at
opening up the essential ingredients you’ll find in the full graph control.
The code accompanying this article can either help you to create your own
custom diagramming tool or, if you wish, go deeper into the code of the
complete Netron library. In the explanation below I’ll point out where this
control differs from the complete one. On the other, more features don’t
necessarily always mean ‘better’. If you only need to display, say, some
XML in a diagram inside your own application, then why would you carry
in a control all the other features? In this sense, this lightweight version of
the Netron library fills a gap in the market since versatility and simplicity
don’t usually co-exist.
I sincerely hope this article will convince you how fun and easy it is to
develop your own owner-drawn control and will launch even more interest
in using diagrams in WinForm applications.
Comments and suggestions are welcome here at CodeProject or via forum
of The Netron Project ([1] and [2]).
A bird’s eye view
Before anything else: when referring to the ‘canvas’ I mean the visible
rectangular part of the diagramming control, the thing underneath the
diagram. Terms like ‘graphs’ and ‘diagrams’, ‘node’ and ‘shape’,
‘connection’ and ‘link’… are equivalent, they just emphasize different
representations of the same things
Creating a graph is, in essence, really simple; get a reference to a
Graphics object and use the available drawing methods to draw. The
System.Drawing namespace (and the namespaces underneath) has
everything you need to create fancy drawings with ease. So far for the
drawing part, the difficulties arise when you want to change the diagram
interactively via the mouse:
- 4 -

Diagramming for dummies
• You could use the Controls collection of the Panel to add owner-
drawn controls and build in this way connected controls, but what
control will you use for a connection?
• When the mouse hovers over a shape, how do you get a pointer to
it?
• If connections are attached to a shape, how do you communicate to
them to move when the shape is moved around?
• When you have moved a shape to a new location, do you need to
re-draw it, do you need to erase the previous location?
The idea to use the Label object (Button object would do as well) and
connect them via a DrawLine() method of the Graphics class actually
works. The problem is that the Label class contains ‘too much’, it inherits
from all its parents; things like drag-drop features, diverse overridable
methods which have not really a meaning in a diagramming context.
Concerning the erase and re-draw question; a custom control re-paints
itself many, many times a minute. Every time the control executes its
OnPaint method the control is cleared and everything is re-painted as if
nothing was present before. It means, hence, that if you do not paint it, it
will not be visible. If you wish to move a shape around you don’t need to
erase the previous location, you simply need to update and paint its
current position. This picture is a bit rough though since you can invalidate
(read: refresh) portions of the control’s space but for now this picture is
good enough.
The remaining other questions stated above actually come down to use
the three basic mouse event handlers in a smart way. We’ll review them
below and explain the strategy.
When the mouse is pressed the overriden OnMouseDown is executed:
• Either the user will move a diagram-element; set a flag to be
checked in the OnMouseMove handler
• Either the user selects an object: find out which object was selected
and set its selected bit to true.
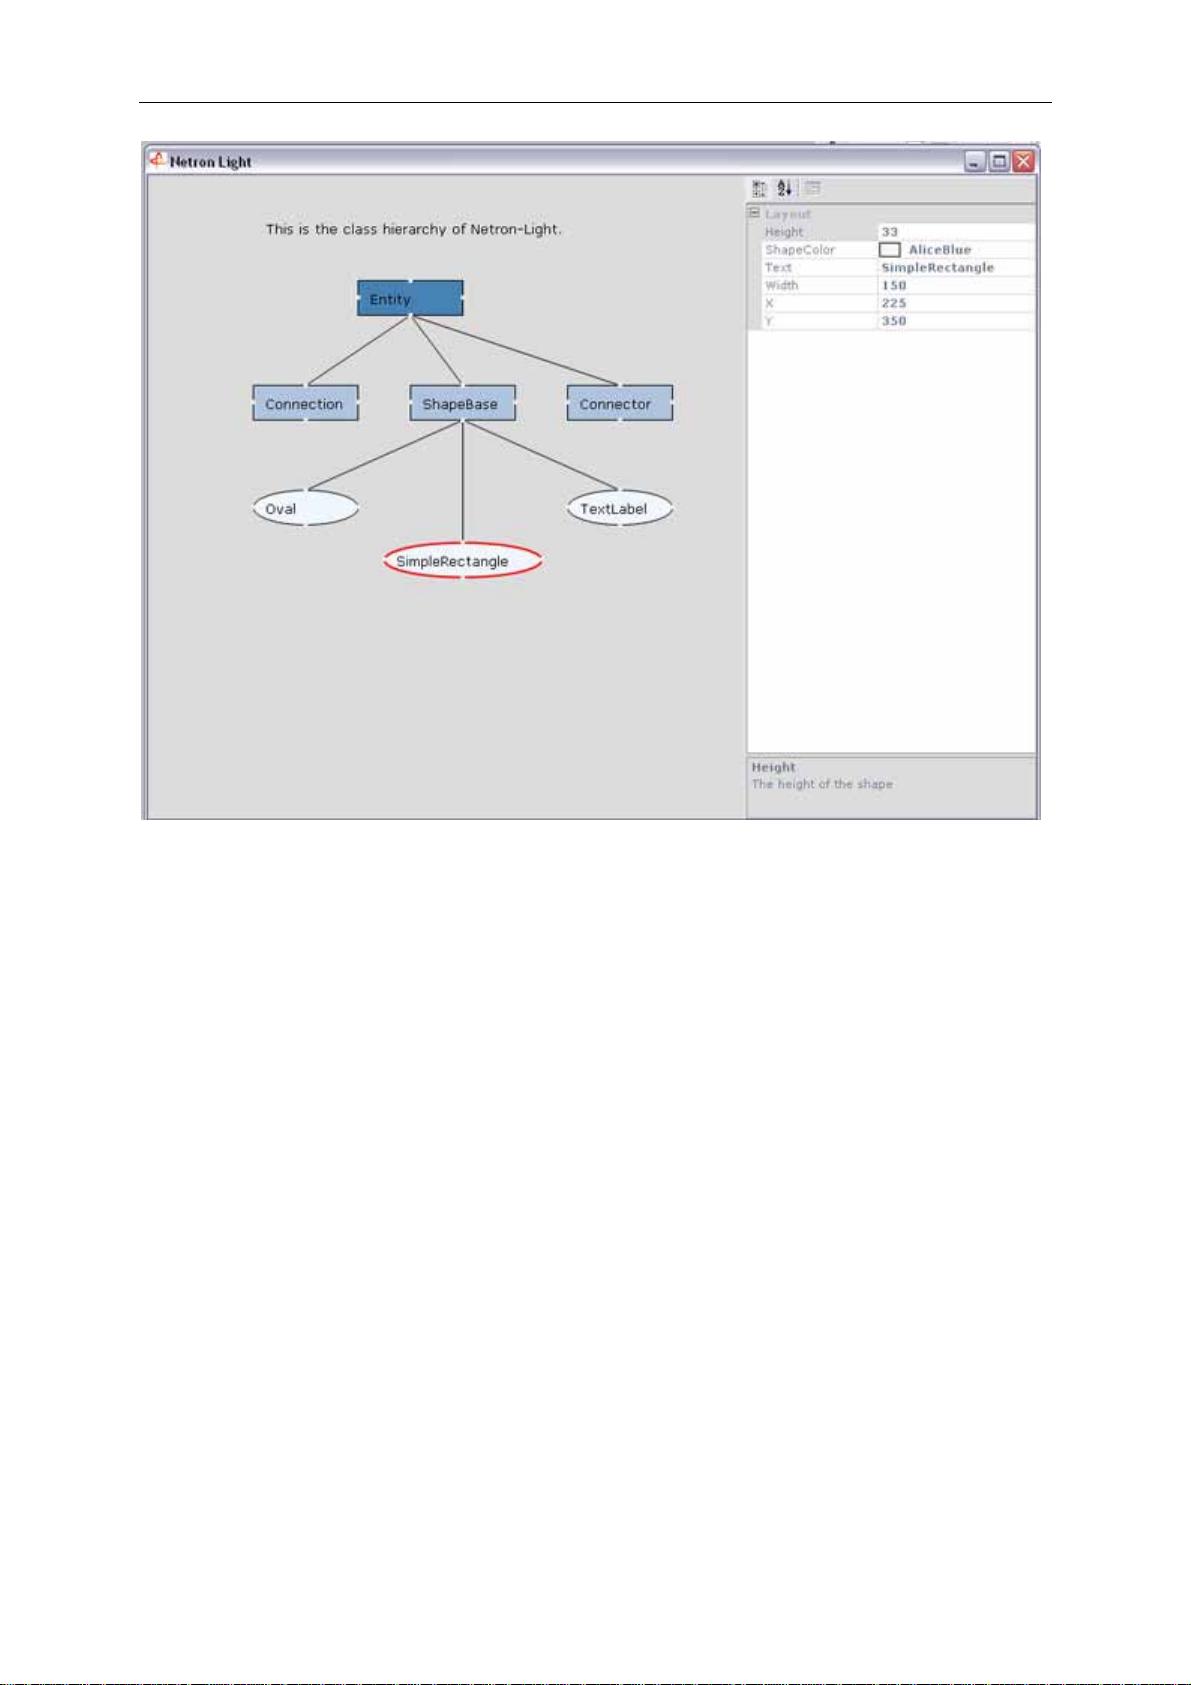
How do you know which shape got selected? Well, the shape needs to say
it if given a certain coordinate. This is precisely what the Hit(Point)
methods does. This method, besides a few others is defined in an abstract
base class, called the Entity class. Herein, all the essential methods are
defined in order for a derived class to participate in the diagramming
game. When the mouse is pressed various loops go over the diagram
elements (shapes, connection , connector) and call the Hit method, the
first one saying ‘yes’ is an (not necessarily unique) object underneath the
mouse and all other loop turns are discarded. The variable selectedEntity
contains now a pointer to one of the diagram elements. This entity can be
of three kinds: shape, connection or connector. It is thanks to the class
hierarchy that you can have this; all diagram elements end their
inheritance chain in the Entity class.
- 5 -


