馃摎 This guide explains how to use **Weights & Biases** (W&B) with YOLOv5 馃殌. UPDATED 29 September 2021.
* [About Weights & Biases](#about-weights-&-biases)
* [First-Time Setup](#first-time-setup)
* [Viewing runs](#viewing-runs)
* [Disabling wandb](#disabling-wandb)
* [Advanced Usage: Dataset Versioning and Evaluation](#advanced-usage)
* [Reports: Share your work with the world!](#reports)
## About Weights & Biases
Think of [W&B](https://wandb.ai/site?utm_campaign=repo_yolo_wandbtutorial) like GitHub for machine learning models. With a few lines of code, save everything you need to debug, compare and reproduce your models 鈥� architecture, hyperparameters, git commits, model weights, GPU usage, and even datasets and predictions.
Used by top researchers including teams at OpenAI, Lyft, Github, and MILA, W&B is part of the new standard of best practices for machine learning. How W&B can help you optimize your machine learning workflows:
* [Debug](https://wandb.ai/wandb/getting-started/reports/Visualize-Debug-Machine-Learning-Models--VmlldzoyNzY5MDk#Free-2) model performance in real time
* [GPU usage](https://wandb.ai/wandb/getting-started/reports/Visualize-Debug-Machine-Learning-Models--VmlldzoyNzY5MDk#System-4) visualized automatically
* [Custom charts](https://wandb.ai/wandb/customizable-charts/reports/Powerful-Custom-Charts-To-Debug-Model-Peformance--VmlldzoyNzY4ODI) for powerful, extensible visualization
* [Share insights](https://wandb.ai/wandb/getting-started/reports/Visualize-Debug-Machine-Learning-Models--VmlldzoyNzY5MDk#Share-8) interactively with collaborators
* [Optimize hyperparameters](https://docs.wandb.com/sweeps) efficiently
* [Track](https://docs.wandb.com/artifacts) datasets, pipelines, and production models
## First-Time Setup
<details open>
<summary> Toggle Details </summary>
When you first train, W&B will prompt you to create a new account and will generate an **API key** for you. If you are an existing user you can retrieve your key from https://wandb.ai/authorize. This key is used to tell W&B where to log your data. You only need to supply your key once, and then it is remembered on the same device.
W&B will create a cloud **project** (default is 'YOLOv5') for your training runs, and each new training run will be provided a unique run **name** within that project as project/name. You can also manually set your project and run name as:
```shell
$ python train.py --project ... --name ...
```
YOLOv5 notebook example: <a href="https://colab.research.google.com/github/ultralytics/yolov5/blob/master/tutorial.ipynb"><img src="https://colab.research.google.com/assets/colab-badge.svg" alt="Open In Colab"></a> <a href="https://www.kaggle.com/ultralytics/yolov5"><img src="https://kaggle.com/static/images/open-in-kaggle.svg" alt="Open In Kaggle"></a>
<img width="960" alt="Screen Shot 2021-09-29 at 10 23 13 PM" src="https://user-images.githubusercontent.com/26833433/135392431-1ab7920a-c49d-450a-b0b0-0c86ec86100e.png">
</details>
## Viewing Runs
<details open>
<summary> Toggle Details </summary>
Run information streams from your environment to the W&B cloud console as you train. This allows you to monitor and even cancel runs in <b>realtime</b> . All important information is logged:
* Training & Validation losses
* Metrics: Precision, Recall, mAP@0.5, mAP@0.5:0.95
* Learning Rate over time
* A bounding box debugging panel, showing the training progress over time
* GPU: Type, **GPU Utilization**, power, temperature, **CUDA memory usage**
* System: Disk I/0, CPU utilization, RAM memory usage
* Your trained model as W&B Artifact
* Environment: OS and Python types, Git repository and state, **training command**
<p align="center"><img width="900" alt="Weights & Biases dashboard" src="https://user-images.githubusercontent.com/26833433/135390767-c28b050f-8455-4004-adb0-3b730386e2b2.png"></p>
</details>
## Disabling wandb
* training after running `wandb disabled` inside that directory creates no wandb run

* To enable wandb again, run `wandb online`

## Advanced Usage
You can leverage W&B artifacts and Tables integration to easily visualize and manage your datasets, models and training evaluations. Here are some quick examples to get you started.
<details open>
<h3> 1: Train and Log Evaluation simultaneousy </h3>
This is an extension of the previous section, but it'll also training after uploading the dataset. <b> This also evaluation Table</b>
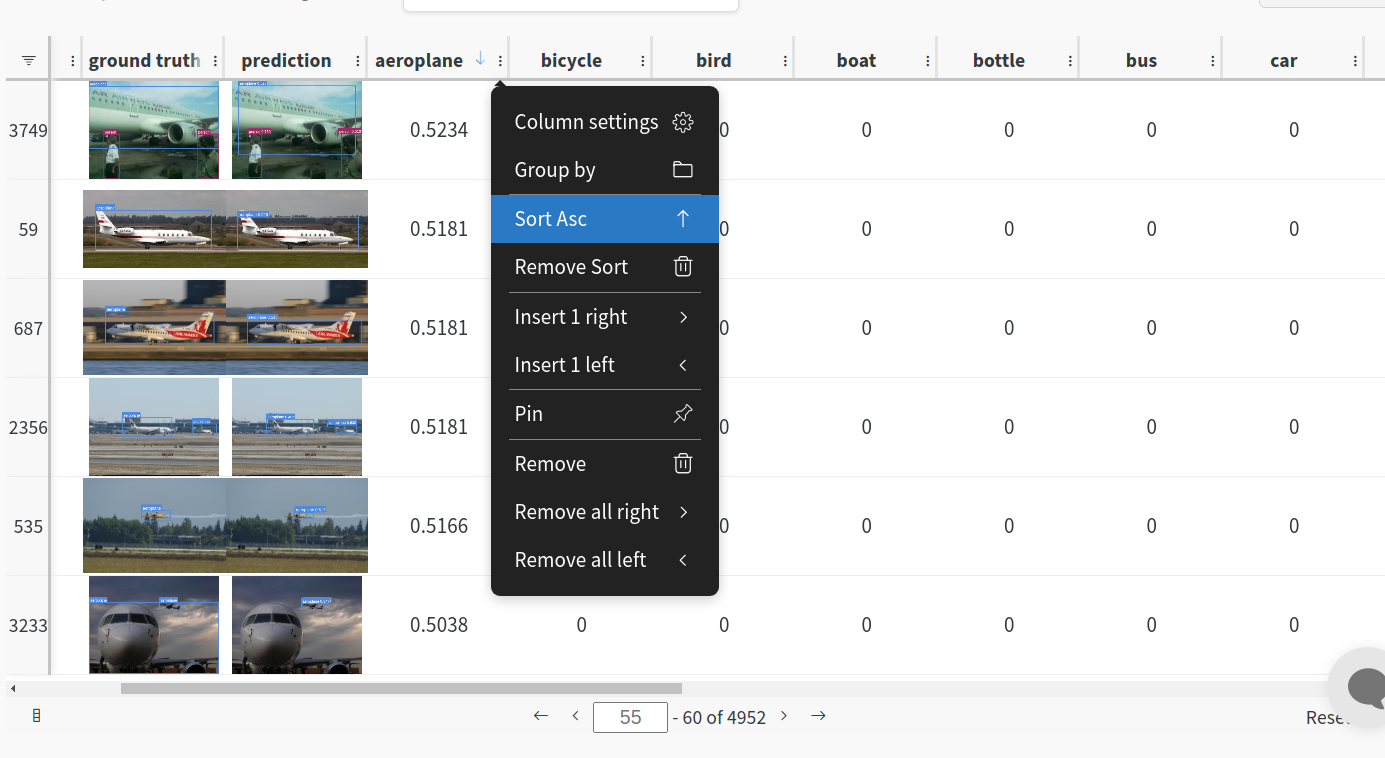
Evaluation table compares your predictions and ground truths across the validation set for each epoch. It uses the references to the already uploaded datasets,
so no images will be uploaded from your system more than once.
<details open>
<summary> <b>Usage</b> </summary>
<b>Code</b> <code> $ python train.py --upload_data val</code>
</details>
<h3>2. Visualize and Version Datasets</h3>
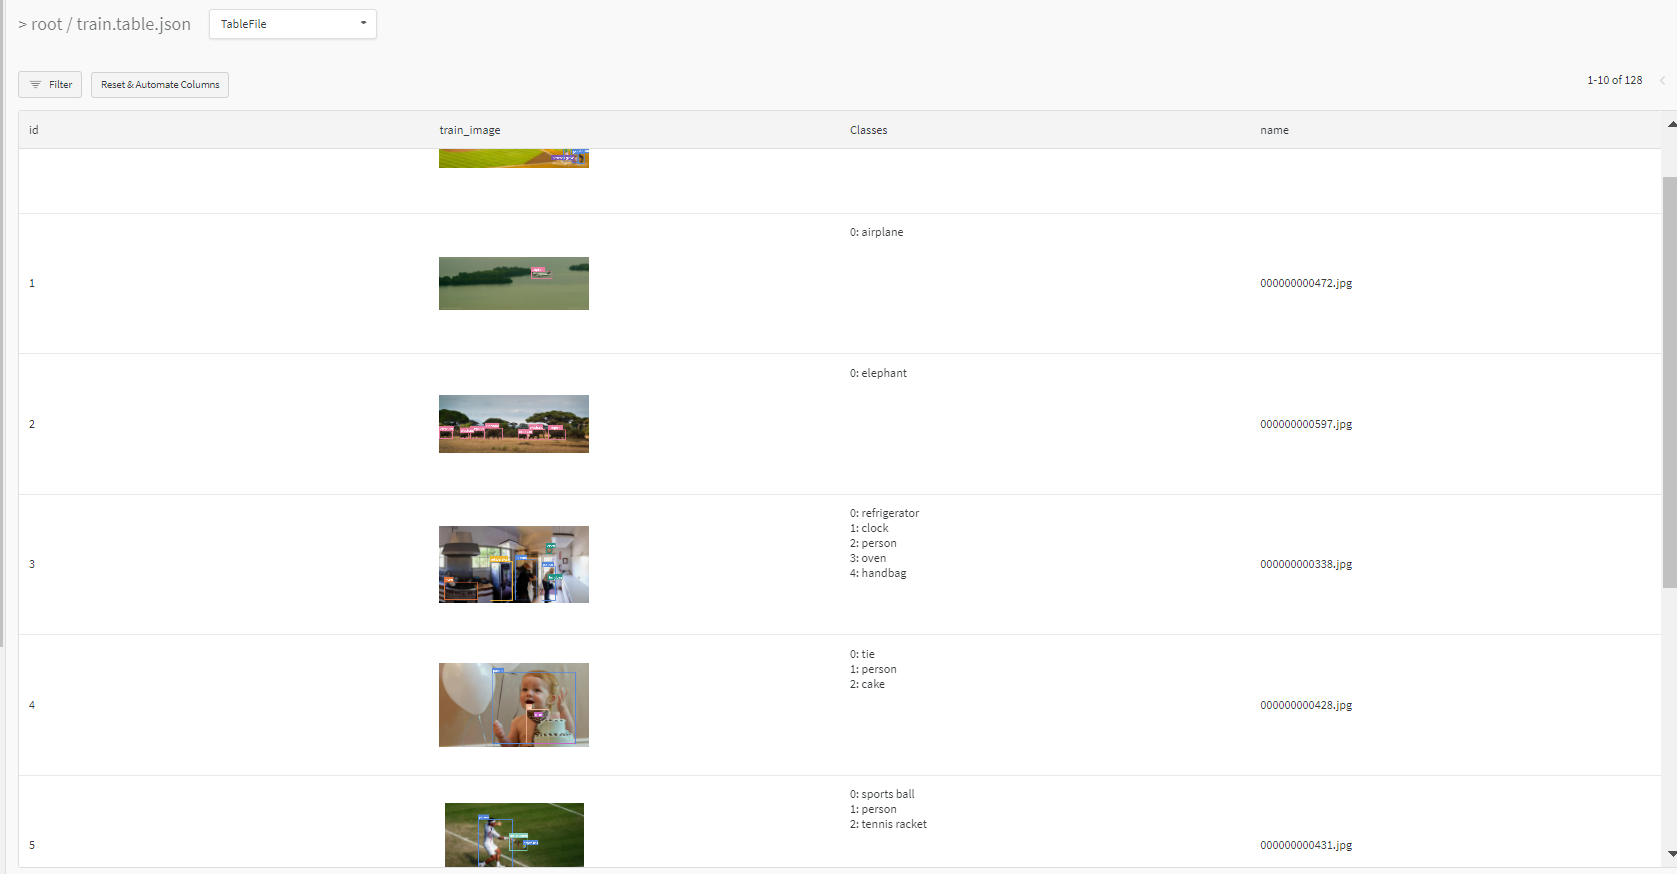
Log, visualize, dynamically query, and understand your data with <a href='https://docs.wandb.ai/guides/data-vis/tables'>W&B Tables</a>. You can use the following command to log your dataset as a W&B Table. This will generate a <code>{dataset}_wandb.yaml</code> file which can be used to train from dataset artifact.
<details>
<summary> <b>Usage</b> </summary>
<b>Code</b> <code> $ python utils/logger/wandb/log_dataset.py --project ... --name ... --data .. </code>
</details>
<h3> 3: Train using dataset artifact </h3>
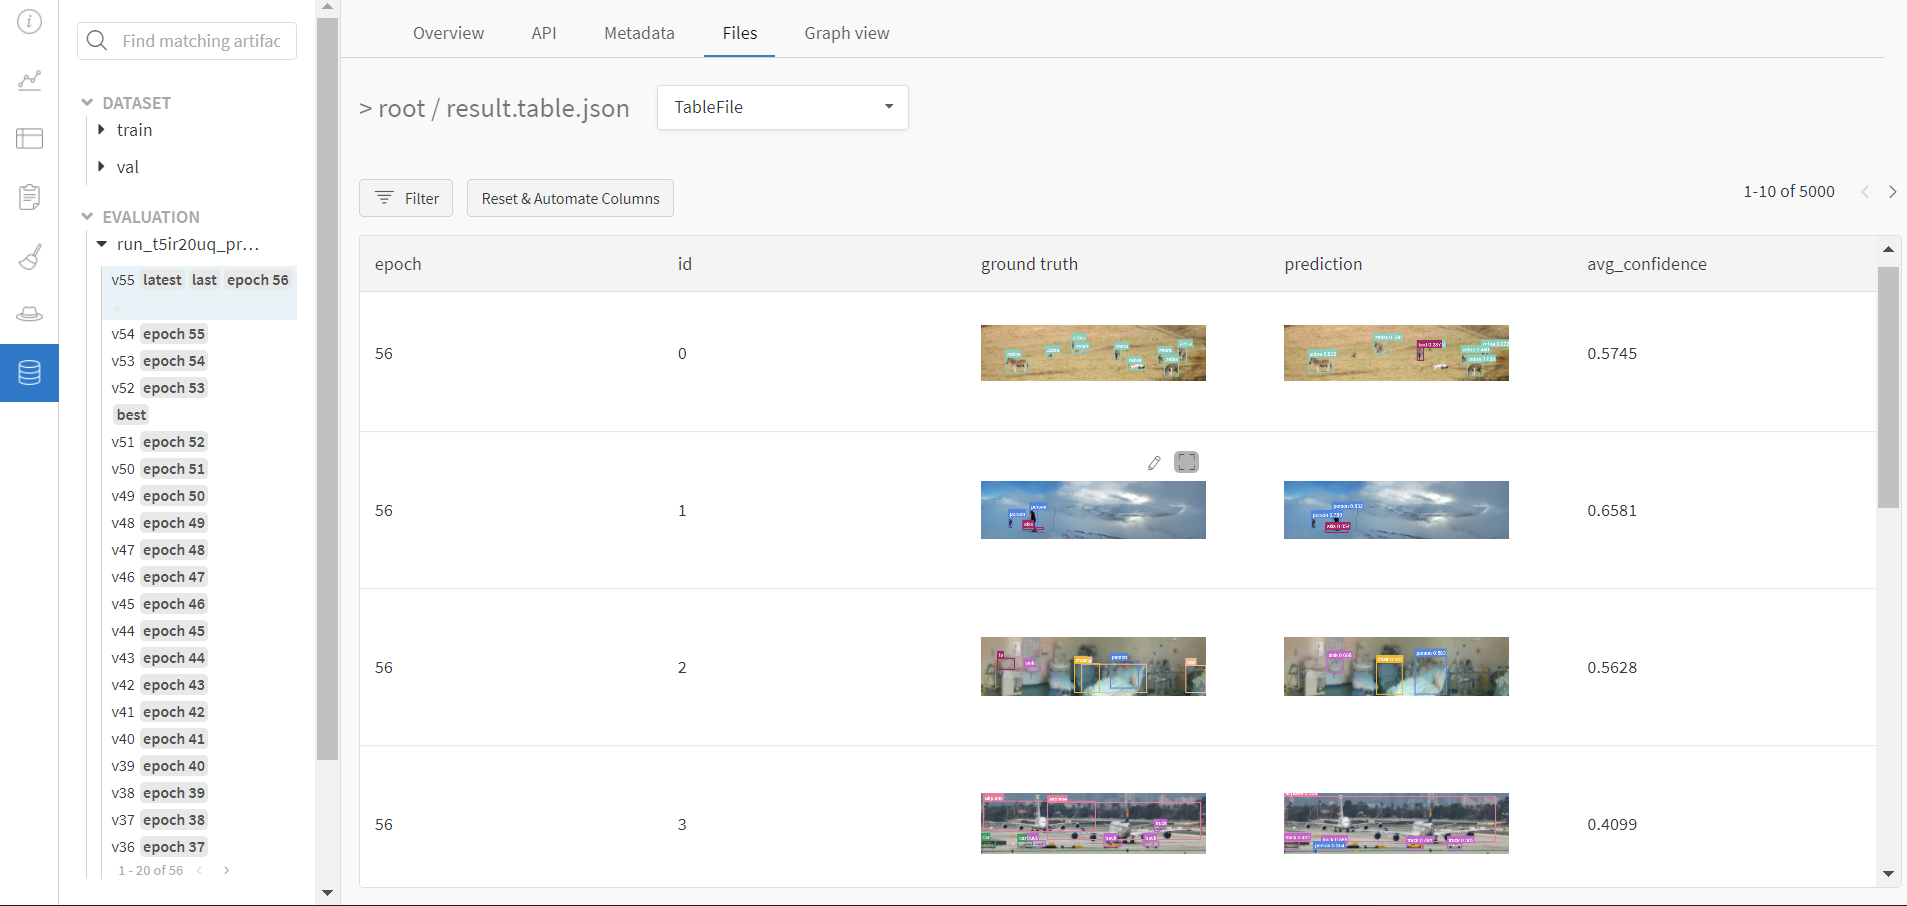
When you upload a dataset as described in the first section, you get a new config file with an added `_wandb` to its name. This file contains the information that
can be used to train a model directly from the dataset artifact. <b> This also logs evaluation </b>
<details>
<summary> <b>Usage</b> </summary>
<b>Code</b> <code> $ python train.py --data {data}_wandb.yaml </code>
</details>
<h3> 4: Save model checkpoints as artifacts </h3>
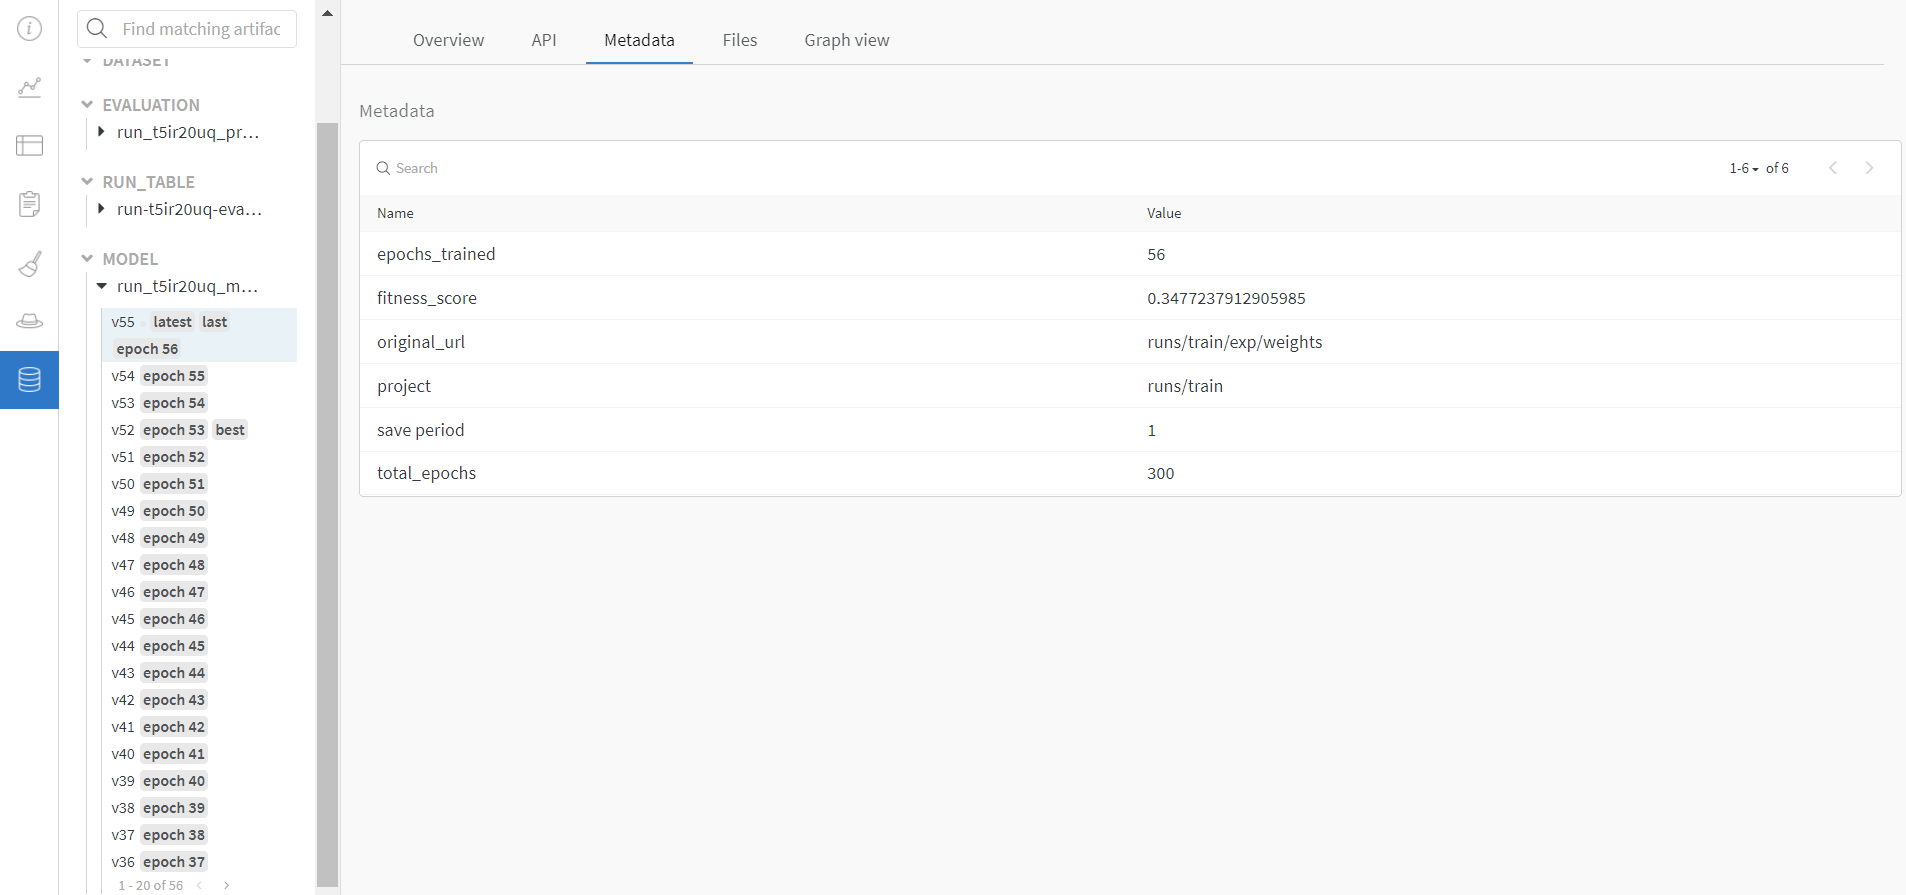
To enable saving and versioning checkpoints of your experiment, pass `--save_period n` with the base cammand, where `n` represents checkpoint interval.
You can also log both the dataset and model checkpoints simultaneously. If not passed, only the final model will be logged
<details>
<summary> <b>Usage</b> </summary>
<b>Code</b> <code> $ python train.py --save_period 1 </code>
</details>
</details>
<h3> 5: Resume runs from checkpoint artifacts. </h3>
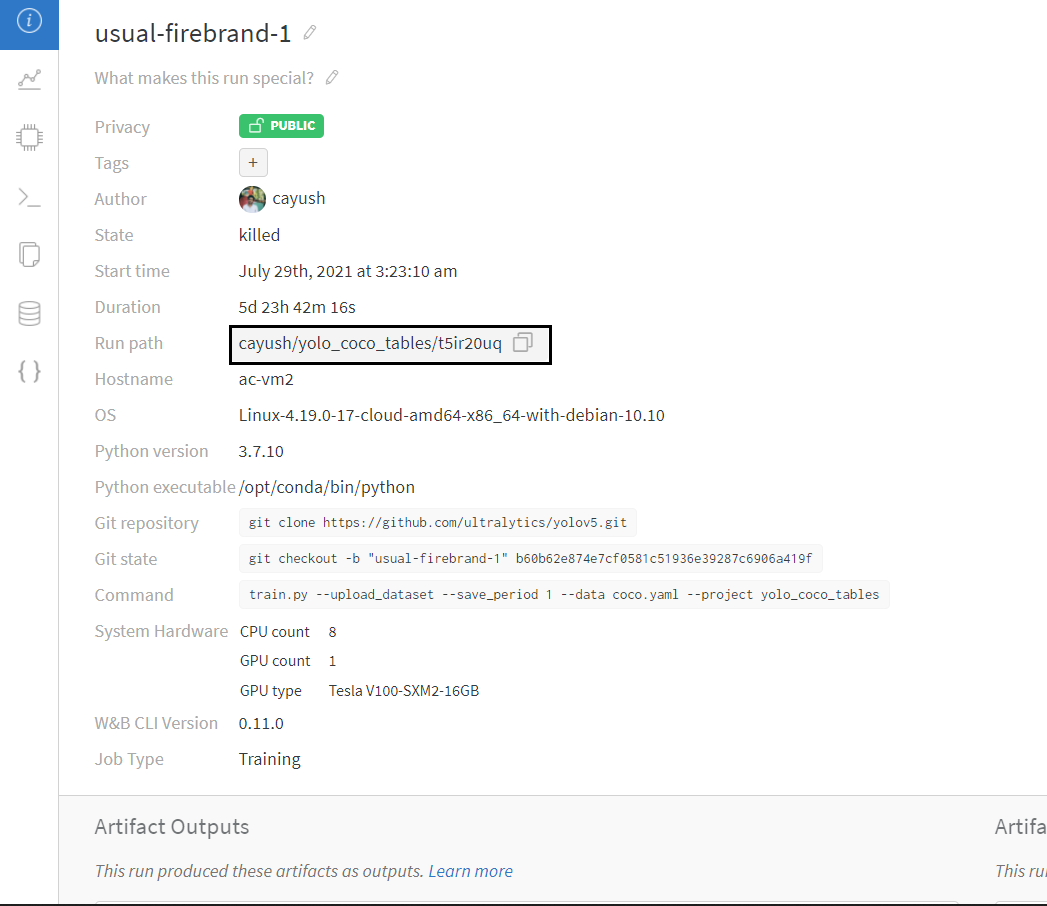
Any run can be resumed using artifacts if the <code>--resume</code> argument starts with聽<code>wandb-artifact://</code>聽prefix followed by the run path, i.e,聽<code>wandb-artifact://username/project/runid </code>. This doesn't require the model checkpoint to be present on the local system.
<details>
<summary> <b>Usage</b> </summary>
<b>Code</b> <code> $ python train.py --resume wandb-artifact://{run_path} </code>
</details>
<h3> 6: Resume runs from dataset artifact & checkpoint artifacts. </h3>
<b> Local dataset or model checkpoints are not required. This can be used to resume runs directly on a different device </b>
The syntax is same as the previous section, but you'll need to lof both the dataset and model checkpoints as artifacts, i.e, set bot <code>--upload_dataset<
龙年行大运
- 粉丝: 1403
- 资源: 3960
最新资源
- 【毕业设计】Python的Django-html知识图谱的医疗问答系统源码(完整前后端+mysql+说明文档+LW+PPT).zip
- 工具变量-数字化激励数据集(2012-2023年).xlsx
- 基于麻雀算法优化深度置信网络的分类预测技术研究:详细Matlab代码注释解析,基于麻雀算法优化深度置信网络的分类预测技术研究:详解Matlab代码注释,基于麻雀算法优化深度置信网络(SSA-DBN)的
- 基于CarSim与Simulink联合的四轮独立驱动电动汽车转矩分配控制策略,包含三自由度车辆模型与离散LQR控制方法,详细控制器文档和稳定性控制目标推导(MATLAB 2018b) ,四轮独立驱动电
- 【毕业设计】SpringBoot+Shiro权限管理系统脚手架【源码+论文+答辩ppt+开题报告+任务书】.zip
- 【毕业设计】SpringBoot+vue仓储物流管理系统【源码+论文+答辩ppt+开题报告+任务书】.zip
- 【毕业设计】SpringBoot+Vue.js的物流管理系统【源码+论文+答辩ppt+开题报告+任务书】.zip
- 【毕业设计】springboot+vue疫情防控管理系统【源码+论文+答辩ppt+开题报告+任务书】.zip
- AI交互革新:Agentic RAG技术从传统RAG到智能代理的技术演变与突破及其应用场景
- 【毕业设计】SpringBoot酒店管理系统【源码+论文+答辩ppt+开题报告+任务书】.zip
- 【毕业设计】springboot-bootstrap 后台管理系统【源码+论文+答辩ppt+开题报告+任务书】.zip
- 【毕业设计】springboot+Vue农产品贸易管理系统【源码+论文+答辩ppt+开题报告+任务书】.zip
- 【毕业设计】springboot+Vue人力资源管理系统【源码+论文+答辩ppt+开题报告+任务书】.zip
- 【毕业设计】vue+springboot教务管理系统【源码+论文+答辩ppt+开题报告+任务书】.zip
- 【毕业设计】基于SpringBoot + Mybatis Plus + SaToken + Thymeleaf + Layui的后台管理系统【源码+论文+答辩ppt+开题报告+任务书】.zip
- 【毕业设计】基于SpringBoot + Mybatis +Vue商品管理系统【源码+论文+答辩ppt+开题报告+任务书】.zip
资源上传下载、课程学习等过程中有任何疑问或建议,欢迎提出宝贵意见哦~我们会及时处理!
点击此处反馈


