没有合适的资源?快使用搜索试试~ 我知道了~
资源推荐
资源详情
资源评论

© Copyright IBM Corporation 2008 Trademarks
DB2 problem determination using db2top utility Page 1 of 36
DB2 problem determination using db2top utility
Optimize performance and prevent problems in complex DB2
environments
Tao Wang (taoewang@ca.ibm.com)
DB2 Advanced Technical Support
IBM
Shen Li (shenli@ca.ibm.com)
DB2 RAS/PD Software Developer
IBM
04 December 2008
Get the best possible performance in complex IBM® DB2® for Linux® and UNIX®
environments with the db2top utility. In this article, you'll learn about the advantages this tool
offers, and see how to use it for monitoring and troubleshooting. In addition, you can follow
two sample cases that illustrate how to use this tool to diagnose real problems in a production
environment.
Introduction
There are several methods to collect information and diagnose DB2 system performance issues.
The snapshot monitor is one of the most commonly used tools to collect information in order to
narrow down a problem. However, most entries in snapshots are cumulative values and show the
condition of the system at a point in time. Manual work is needed to get delta value for each entry
from one snapshot to the next.
The db2top tool comes with DB2, and can be used to calculate the delta values for those snapshot
entries in real time. This tool provides a GUI under a command line mode, so that users can get
a better understanding while reading each entry. This tool also integrates multiple types of DB2
snapshots, categorizes them, and presents them in different screens for the GUI environment.
This article introduces some commonly used screens in db2top utility in daily performance
monitoring and troubleshooting work. You'll have a chance to examine several examples that show
how to use this tool to narrow down problems in real cases. After reading this article, you will be
able to:
• Understand how the db2top utility works

developerWorks® ibm.com/developerWorks/
DB2 problem determination using db2top utility Page 2 of 36
• Interpret the most useful entries in several most commonly used screens
• Monitor system performance, know whether there is something abnormal in daily operations,
and be able to solve the problem by using db2top.
Read on, or link directly to the section that interests you:
• db2top command syntax
• How to start db2top
• Run db2top in interactive mode
• Run db2top in batch mode
• What can be monitored by db2top?
• Database (d)
• Tablespace (t)
• Dynamic SQL (D)
• Session (l)
• Bufferpool (b)
• Lock (U)
• Table (T)
• Bottlenecks (B)
• Case analysis
• Case 1: Lock waiting analysis in interactive mode
• Case 2: Performance analysis in replay mode
• Conclusion
Most entries or elements of interest are highlighted in red on figures or in bold text.
All the screenshots are captured from running db2top in interactive mode.
In this article, database "sample" will be used in each example and screenshot.
db2top command syntax
This article does not discuss the db2top command syntax in detail. Detailed command syntax and
the user manual can be found in the DB2 Information Center.
Usage: db2top [-d dbname] [-n nodename] [-u username] [-p password] [-V schema]
[-i interval] [-P [part]] [-a] [-B] [-R] [-k] [-x]
[-f file [+time] [/HH:MM:SS]]
[-b options [-s [sample]] [-D separator] [-X] -o outfile]
[-C] [-m duration]
db2top -h
-d : Database name (default DB2DBDFT)
-n : Node name
-u : User name
-p : User password
-V : Default explain schema
-i : Interval in seconds between snapshots
-b : background mode
option: d=database, l=sessions, t=tablespaces, b=bufferpools, T=tables,
D=Dynamic SQL, s=Statements, U=Locks, u=Utilities, F=Federation,
m=Memory -X=XML Output, -L=Write queries to ALL.sql,
-A=Performance analysis
-o : output file for background mode

ibm.com/developerWorks/ developerWorks®
DB2 problem determination using db2top utility Page 3 of 36
-a : Monitor only active objects
-B : enable bold
-R : Reset snapshot at startup
-k : Display cumulated counters
-x : Extended display
-P : Partition snapshot (number or current)
-f : Replay monitoring session from snapshot data collector file,
can skip entries when +seconds is specified
-D : Delimiter for -b option
-C : Run db2top in snapshot data collector mode
-m : Max duration in minutes for -b and -C
-s : Max # of samples for -b
-h : this help
Parameters can be set in $HOME/.db2toprc, type w in db2top to generate the resource
configuration file.
How to start db2top
db2top can be run in two modes, interactive mode or batch mode. In interactive mode, the user
enters command directly at the terminal text user interface and waits for the system to respond.
Note that the left and right arrow keys on the keyboard can be used to scroll columns to left or
right, so that you can see the hidden columns on many screens in interactive mode. On the other
hand, in batch mode a series of jobs are executed without user interaction.
Run db2top in interactive mode
Enter the following command from a command line to start db2top in interactive mode:
db2top -d sample

developerWorks® ibm.com/developerWorks/
DB2 problem determination using db2top utility Page 4 of 36
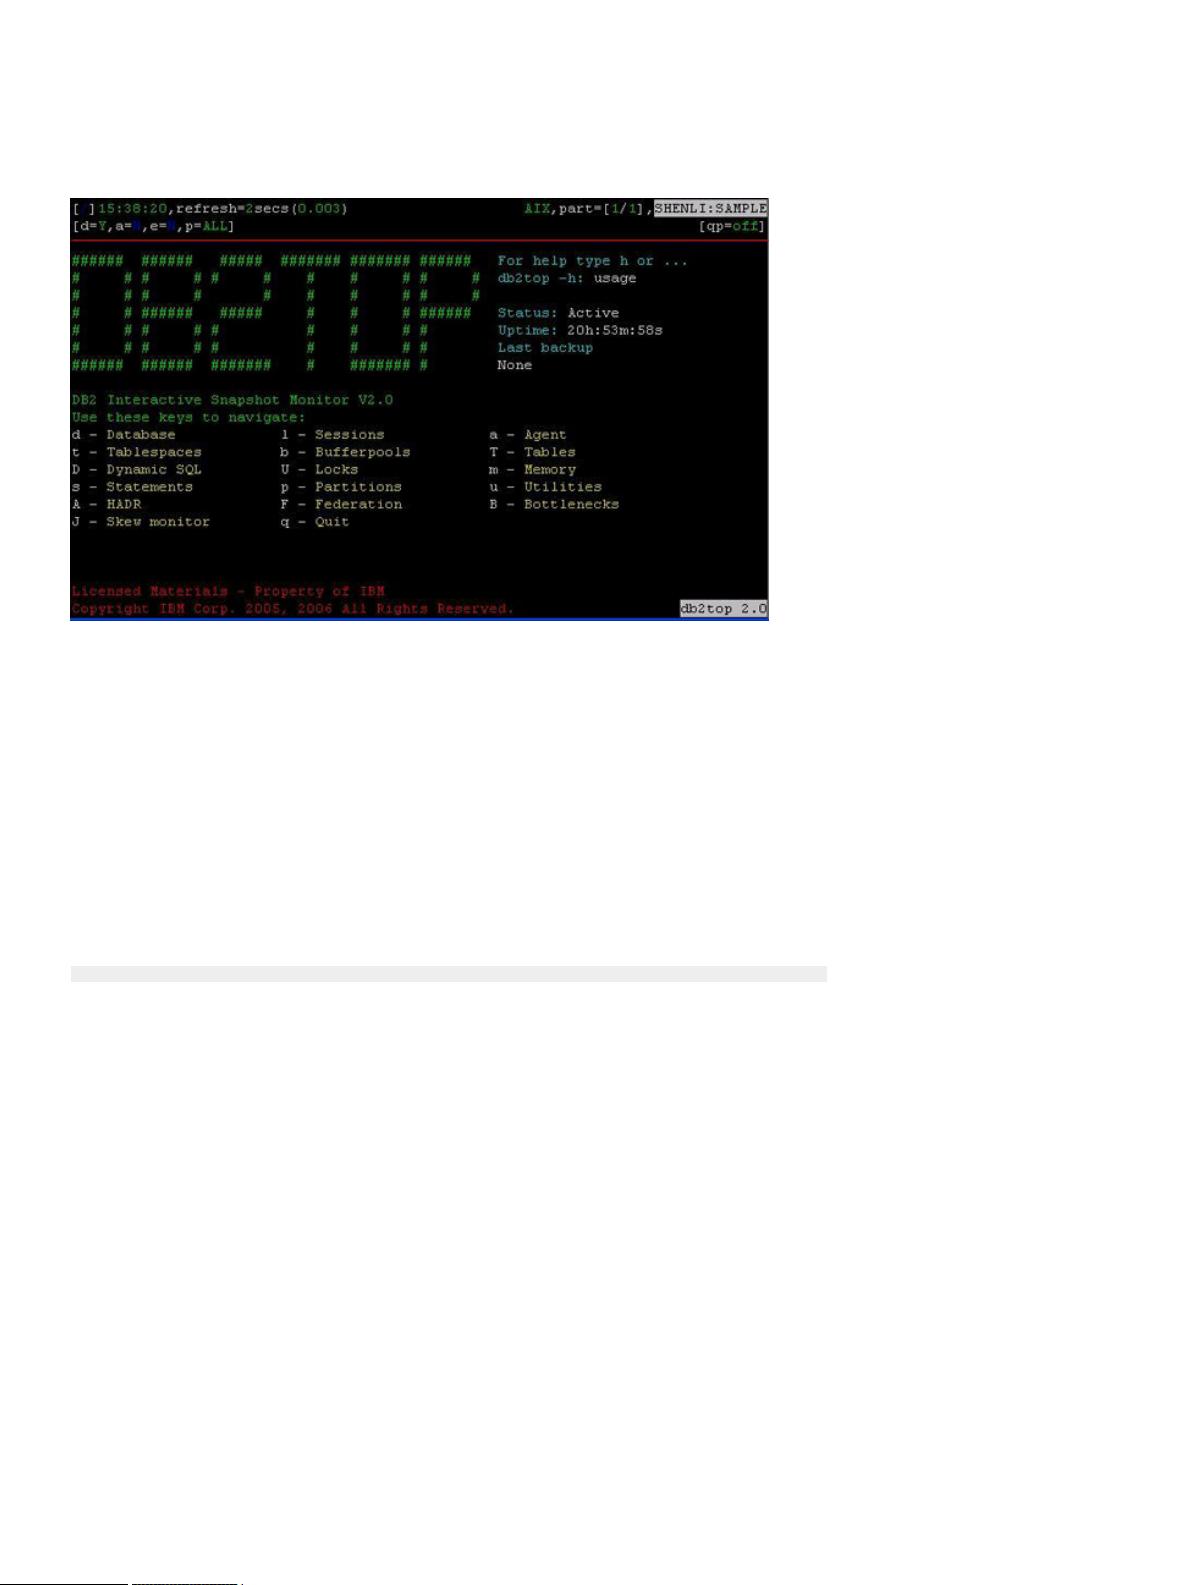
Figure 1. To run db2top in interactive mode
In Figure 1, field values are returned at the top of the screen:
[\]15:38:20, refresh=2secs(0.003) AIX, part=[1/1],SHENLI:SAMPLE
• [/]: When rotating, it means that db2top is waiting between two snapshots, otherwise, it
means db2top is waiting for an answer from DB2.
• 15:38:20: Current time
• refresh=2secs: Time interval
• refresh=!secs: The exclamation mark means the time to process the snapshot by DB2 is
longer than the refresh interval. In this case, db2top increases the interval by 50 percent. If
this occurs too often because the system is too busy, you can either increase the snapshot
interval (option I), monitor a single database partition (option P), or turn off extended display
mode (option x).
• 0.003: Time spent inside DB2 to process the snapshot
• AIX: Platform on which DB2 is running
• Inactive: Means that the database has not been activated, otherwise it indicates that the
database is activated.
• part=[1/1]: Active database partition number versus total database partition number. For
example, part=[2,3] means one database partition out of three is down (2 active, 3 total).

ibm.com/developerWorks/ developerWorks®
DB2 problem determination using db2top utility Page 5 of 36
• SHENLI: Instance name
• SAMPLE: Database name
[d=Y,a=N,e=N,p=ALL] [qp=off]
• d=Y/N: Delta or cumulative snapshot indicator (command option -k or option k)
• a=Y/N: Active only or all objects indicator (-a command option set or i)
• e=Y/N: Extended display indicator
• p=ALL: All database partitions
• p=CUR: Current database partition (-P command option with no partition number specified)
• p=3: Target database partition number: say 3
• db2top can be used to monitor a DPF environment. If the -P command option is not specified,
a global snapshot should be captured.
• qp=off/on: Query patroller indicator (DYNMGMT database configuration parameter) for the
database partition on which db2top is attached
Below the status field, a user manual is displayed and can be selected by pressing keys on the
keyboard.
Run db2top in batch mode
You can use db2top in batch mode to monitor a running database unattended. Users can record
performance information using db2top in the background and the historical data is stored for
further analysis.
The following code listing shows how you would run db2top in collection mode for a long period
(for example, eight hours in total, and a 15 seconds interval between each snapshot):
db2top -d sample -f collect.file -C -m 480 -i 15
[11:36:02] Starting DB2 snapshot data collector, collection every 15 second(s),
max duration 480 minute(s), max file growth/hour 100.0M,
hit [CTRL+C] to cancel...
[11:36:02] Writing to 'collect.file',
should I create a named pipe instead of a file [N/y]? N
Make sure N is input to answer the question.
After the data has been collected into the file, users can use the following commands to run db2top
in replay mode, in order to analyze the data gathered during the period of data collection:
db2top -d sample -f collect.file -b l -A
Option -A enables automatic performance analysis. So, the above command will analyze the most
active sessions, which takes up the most CPU usage.
The following command runs db2top in replay mode, jumping to the time of interest to analyze.
db2top -d sample -f collect.file /HH:MM:SS
For example, the user restarts db2top in replay mode and it jumps to 2am exactly:
剩余35页未读,继续阅读
资源评论

Tankzhang
- 粉丝: 0
- 资源: 3
上传资源 快速赚钱
 我的内容管理
展开
 我的资源
快来上传第一个资源
 我的收益 登录查看自己的收益
 我的积分
登录查看自己的积分
 我的C币
登录后查看C币余额
 我的收藏
我的收藏  我的下载
我的下载  下载帮助
下载帮助

 前往需求广场,查看用户热搜
最新资源
资源上传下载、课程学习等过程中有任何疑问或建议,欢迎提出宝贵意见哦~我们会及时处理!
点击此处反馈


安全验证
文档复制为VIP权益,开通VIP直接复制
 信息提交成功