self.pieChartView.transparentCircleColor = [UIColor colorWithRed:210/255.0 green:145/255.0 blue:165/255.0 alpha:0.3];//半透明空心的颜色
3. 设置饼状图中心的文本设置饼状图中心的文本
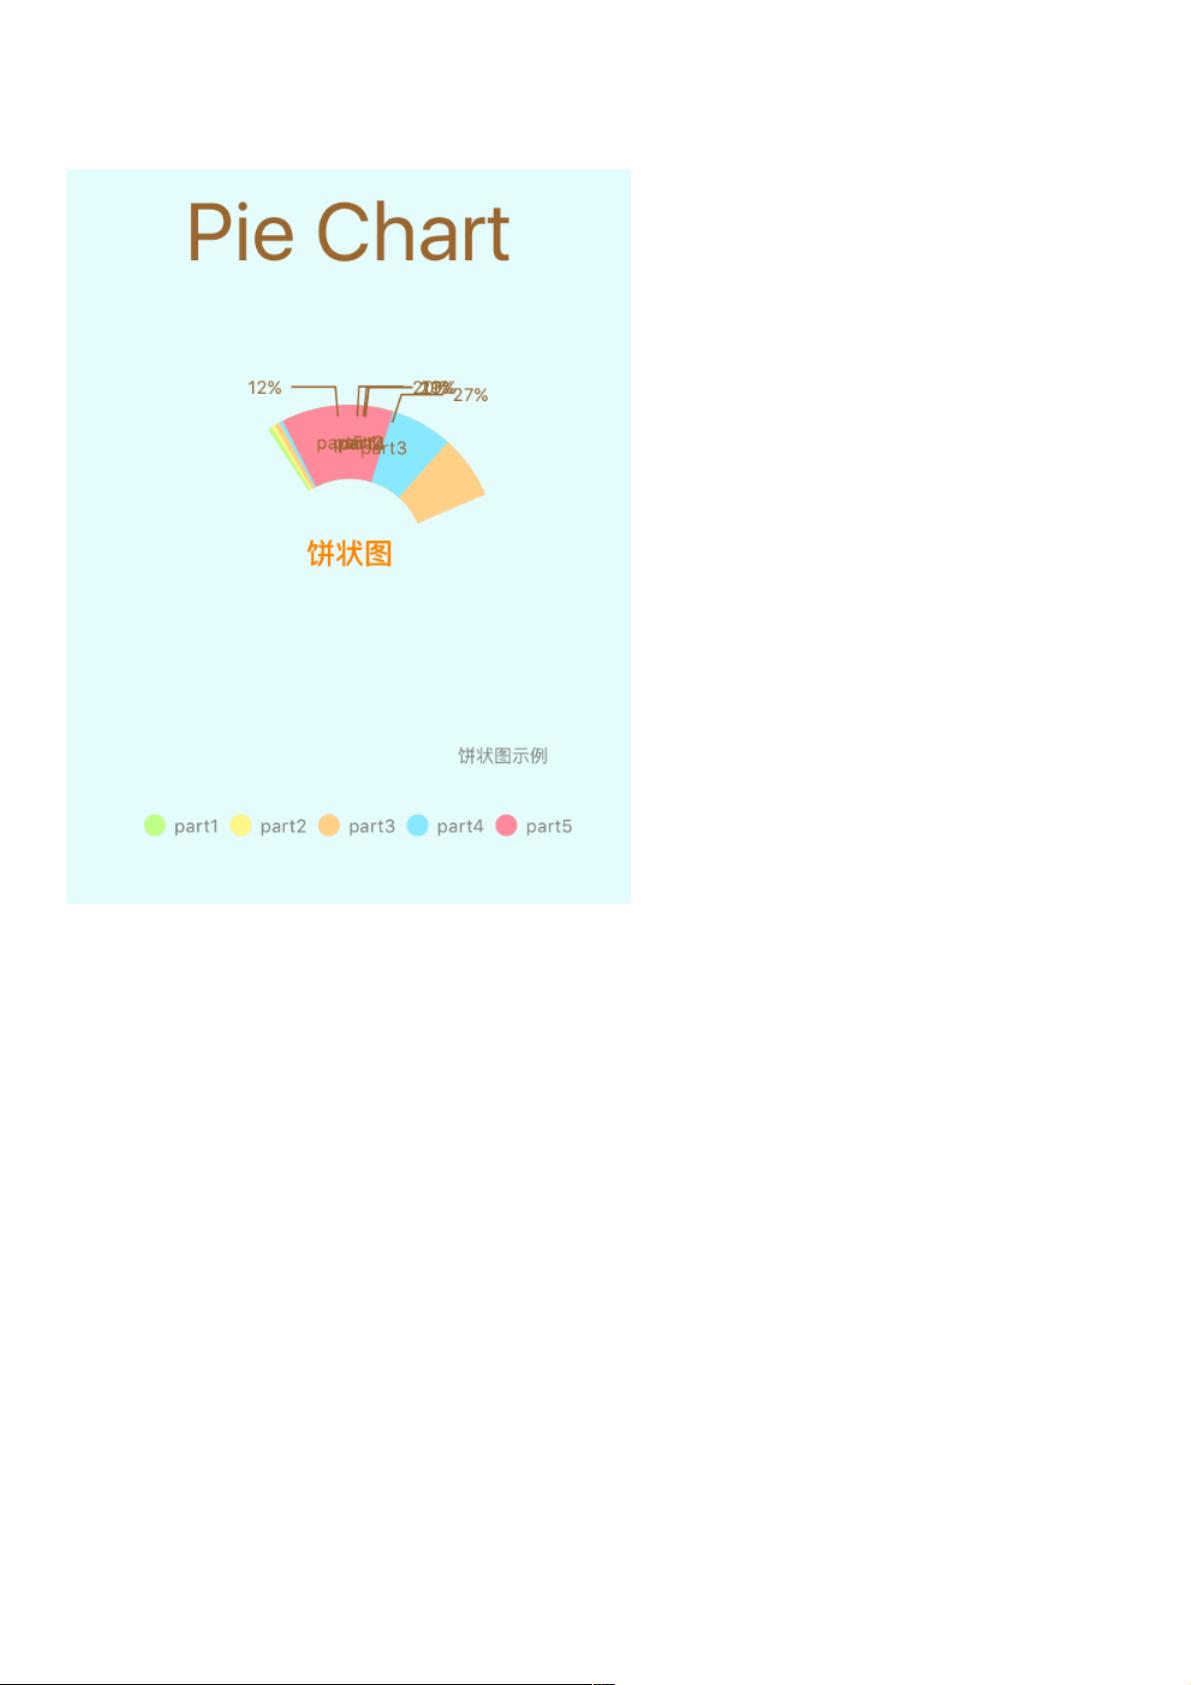
当饼状图是空心样式时, 可以在饼状图中心添加文本, 添加文本有两种方法. 一种方法是使用centerText 属性添加, 这种方法不能
设置字体颜色、大小等. 另一种方法是使用centerAttributedText属性添加, 这种方法添加的富文本, 因此就可以对字体进行进一
步美化了. 代码如下:
if (self.pieChartView.isDrawHoleEnabled == YES) {
self.pieChartView.drawCenterTextEnabled = YES;//是否显示中间文字
//普通文本
// self.pieChartView.centerText = @"饼状图";//中间文字
//富文本
NSMutableAttributedString *centerText = [[NSMutableAttributedString alloc] initWithString:@"饼状图"];
[centerText setAttributes:@{NSFontAttributeName: [UIFont boldSystemFontOfSize:16],
NSForegroundColorAttributeName: [UIColor orangeColor]}
range:NSMakeRange(0, centerText.length)];
self.pieChartView.centerAttributedText = centerText;
}
4. 设置饼状图描述设置饼状图描述
self.pieChartView.descriptionText = @"饼状图示例";
self.pieChartView.descriptionFont = [UIFont systemFontOfSize:10];
self.pieChartView.descriptionTextColor = [UIColor grayColor];
6. 设置饼状图图例样式设置饼状图图例样式
self.pieChartView.legend.maxSizePercent = 1;//图例在饼状图中的大小占比, 这会影响图例的宽高
self.pieChartView.legend.formToTextSpace = 5;//文本间隔
self.pieChartView.legend.font = [UIFont systemFontOfSize:10];//字体大小
self.pieChartView.legend.textColor = [UIColor grayColor];//字体颜色
self.pieChartView.legend.position = ChartLegendPositionBelowChartCenter;//图例在饼状图中的位置
self.pieChartView.legend.form = ChartLegendFormCircle;//图示样式: 方形、线条、圆形
self.pieChartView.legend.formSize = 12;//图示大小
三、为饼状图提供数据三、为饼状图提供数据
为饼状图提供数据, 首先需要创建两个数组yVals和xVals, yVals数组存放饼状图每个区块的数据, xVals存放的是每个区块的名
称或者描述.
接着需要用PieChartDataSet.h类创建dataSet对象, 创建时将yVals放进去.
然后需要用PieChartData.h类创建data对象, 创建时将xVals和dataSet对象放进去.
最后直接把data对象赋值给饼状图的data属性即可. 创建data对象代码如下:
- (PieChartData *)setData{
double mult = 100;
int count = 5;//饼状图总共有几块组成
//每个区块的数据
NSMutableArray *yVals = [[NSMutableArray alloc] init];
for (int i = 0; i < count; i++) {
double randomVal = arc4random_uniform(mult + 1);
BarChartDataEntry *entry = [[BarChartDataEntry alloc] initWithValue:randomVal xIndex:i];
[yVals addObject:entry];
}
//每个区块的名称或描述
NSMutableArray *xVals = [[NSMutableArray alloc] init];
for (int i = 0; i < count; i++) {
NSString *title = [NSString stringWithFormat:@"part%d", i+1];
[xVals addObject:title];
}
//dataSet
PieChartDataSet *dataSet = [[PieChartDataSet alloc] initWithYVals:yVals label:@""];
dataSet.drawValuesEnabled = YES;//是否绘制显示数据
NSMutableArray *colors = [[NSMutableArray alloc] init];
[colors addObjectsFromArray:ChartColorTemplates.vordiplom];
[colors addObjectsFromArray:ChartColorTemplates.joyful];
[colors addObjectsFromArray:ChartColorTemplates.colorful];
[colors addObjectsFromArray:ChartColorTemplates.liberty];
[colors addObjectsFromArray:ChartColorTemplates.pastel];
[colors addObject:[UIColor colorWithRed:51/255.f green:181/255.f blue:229/255.f alpha:1.f]];
dataSet.colors = colors;//区块颜色
dataSet.sliceSpace = 0;//相邻区块之间的间距