Matlab 绘制箭头坐标轴图形
1. 函数功能
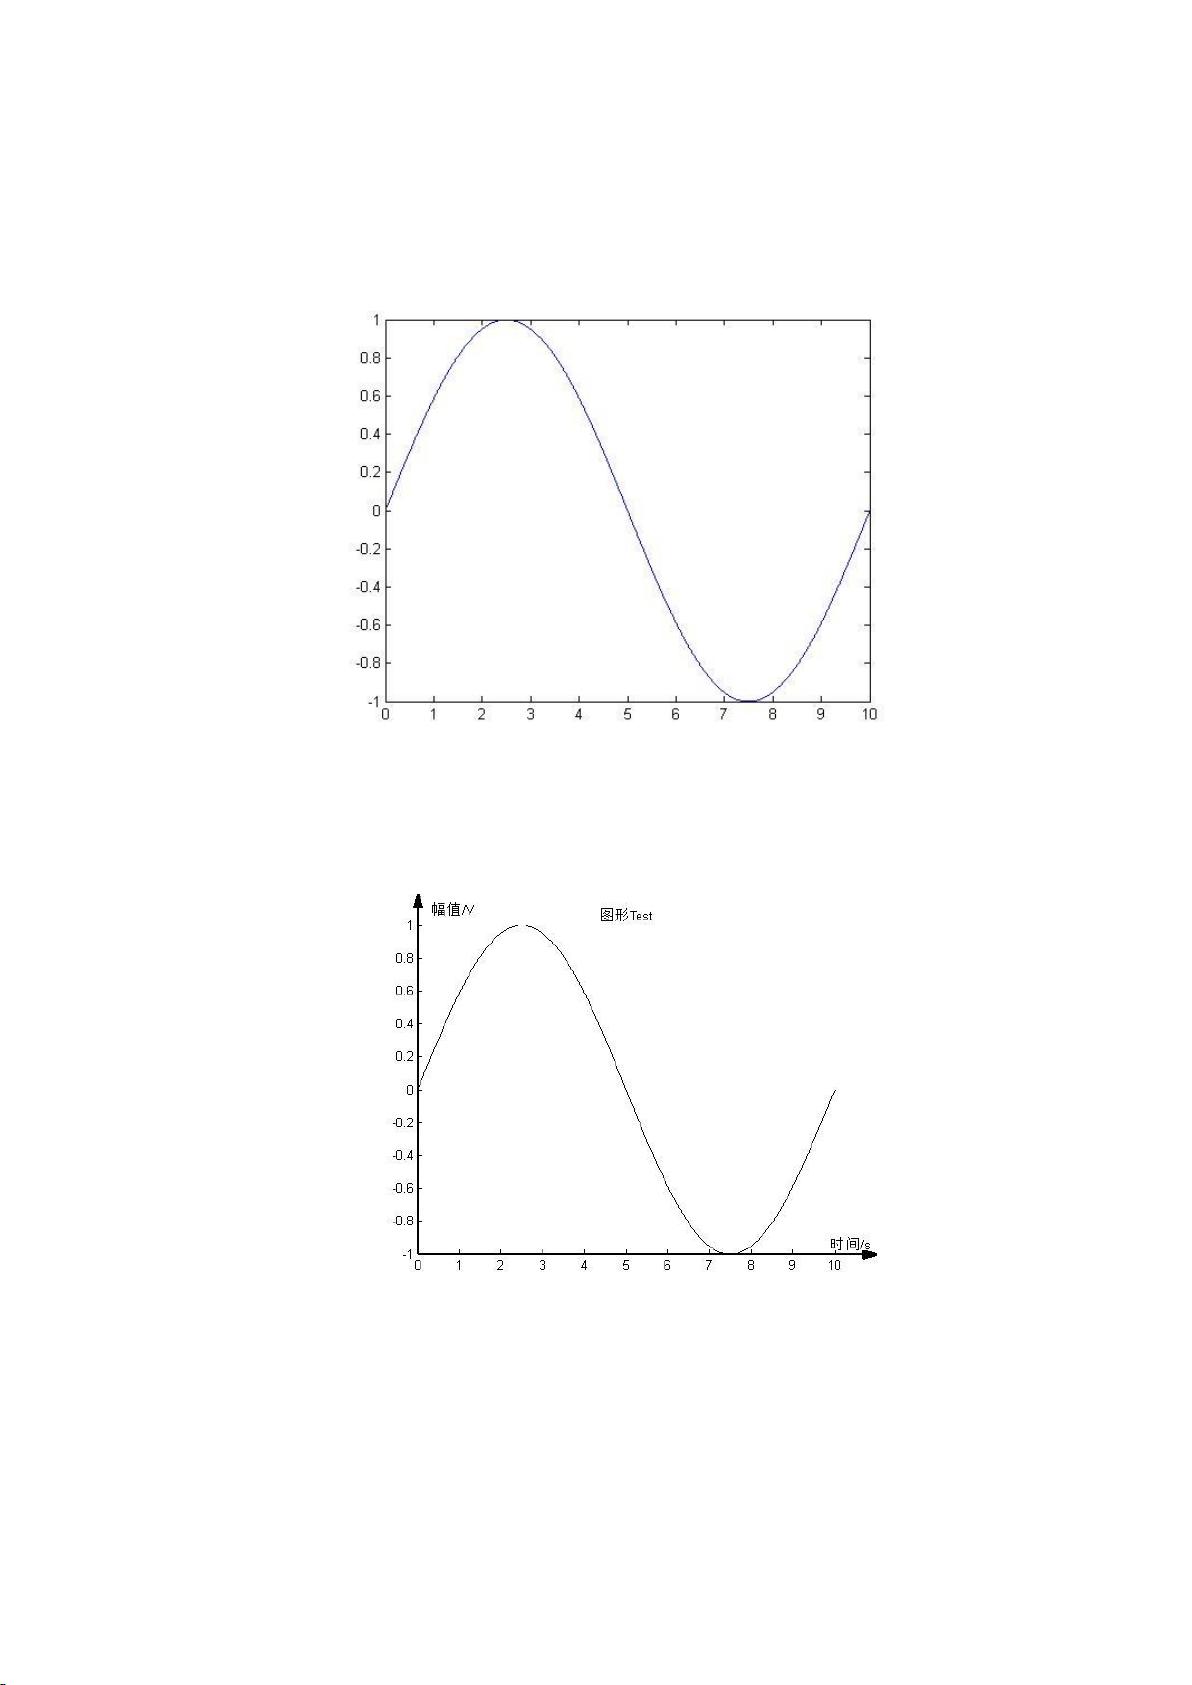
Matlab 自带绘图函数,坐标轴不带箭头,如下所示:
有时经常需要使用 Matlab 绘制坐标轴带有箭头的图形,特别是一些原理性的图形,只
需要定性表达曲线的变化趋势,无需精确表达曲线的数量关系,这时使用带箭头的坐标轴显
得更加美观。本程序可实现绘制坐标轴带有箭头的图形,程序调用格式与系统自带的绘图函
数 plot 等一致,使用起来相当方便。

 Matlab绘制箭头坐标轴图形.rar (14个子文件)
  BK02 文档和程序 PlotWithArrow_Code
  ischild.m 470B Checked_rec.m 867B isfigure.m 333B Arrow_XY.m 2KB saturate.m 632B set_handle.m 283B stem_self.m 396B Arrow_Ylabel.m 3KB isaxes.m 327B Arrow_Xlabel.m 3KB plot_with_arrow_Test.m 6KB plot_with_arrow.m 6KB Arrow_Title.m 2KB
 Matlab绘制箭头坐标轴图形.pdf 406KB


评论0