


ACI3_1
System Document
C2000 Foundation Software

Texas Instruments Inc., March 2003
2
Table of Contents
1 SYSTEM OVERVIEW ......................................................................................................................3
2 HARDWARE CONFIGURATION......................................................................................................8
3 SOFTWARE CONFIGURATION.....................................................................................................10
3.1 C28X REAL ACI3_1 DEMO DIRECTORY STRUCTURE .......................................................................10
3.2 LOADING AND BUILDING CCS PROJECT FOR C “IQMATH” REAL ACI3_1 DEMO.....................................10
4 INCREMENTAL SYSTEM BUILD...................................................................................................13
4.1 PHASE 1 INCREMENTAL SYSTEM BUILD..........................................................................................14
4.2 PHASE 2 INCREMENTAL SYSTEM BUILD..........................................................................................15
4.2a Phase 2a (SVGEN_MF test)................................................................................................15
4.2b Phase 2b (FC_PWM_DRV test)...........................................................................................16
4.2c Phase 2c (CAP_EVENT_DRV/SPEED_PRD test) ................................................................16
4.3 PHASE 3 INCREMENTAL SYSTEM BUILD..........................................................................................19

Texas Instruments Inc., March 2003
3
System Overview
1 System Overview
This document describes the “C” real control framework to demonstrate the ACI3_1 demo
implemented using Code Composer Studio (CCS) version 2.2. The “C” framework is designed to
run on TMS320C28x based controller on CCS V2.2.
The framework uses the following modules viz.,
1. EN_DRIVE
2. PWMDAC
3. PID_REG3
4. RAMP_CNTL
5. VHZ_PROFILE
6. SVGEN_MF
7. PWMGEN
8. CAPTURE
9. SPEED_PRD
In this system, the scalar control (V/Hz) of Induction Motor will be experimented and explored the
performance of speed control. The user can quickly start evaluating the performance of V/Hz
system.
The PWMDAC output is available in the case of TMS320X28X DSP series, which has two Event
Managers. This is due to the fact that the PWMDAC_DRV uses Timer T3 available in Event
Manager B (EVB) to generate 30 kHz PWM outputs.
The ACI3_1 demo has the following properties
C Frame work
System Name Program memory usage Data memory usage
1
ACI3_1 (IQ) 2657 words
2
580 words
Development/Emulation Code Composer Studio V.2.20 (or above) with Real Time debugging
Target Controller Spectrum Digital – TMS320C28x board
Emulator XDS510PP-PLUS
PWM Frequency 20 kHz (PWMGEN, Timer 1-EVA), 30 kHz (PWMDAC, Timer 3-EVB)
PWM Mode Symmetrical with a programmable dead band (PWMGEN)
Interrupts 1 (Timer T1 underflow – Implements 20 kHz ISR execution rate)
Peripheral Used Timer T1/T3, PWM7/9/11
1
Excluding the Stack Size
2
Excluding “IQmath” Look-up Tables
Texas Instruments Inc., March 2003
4
System Overview
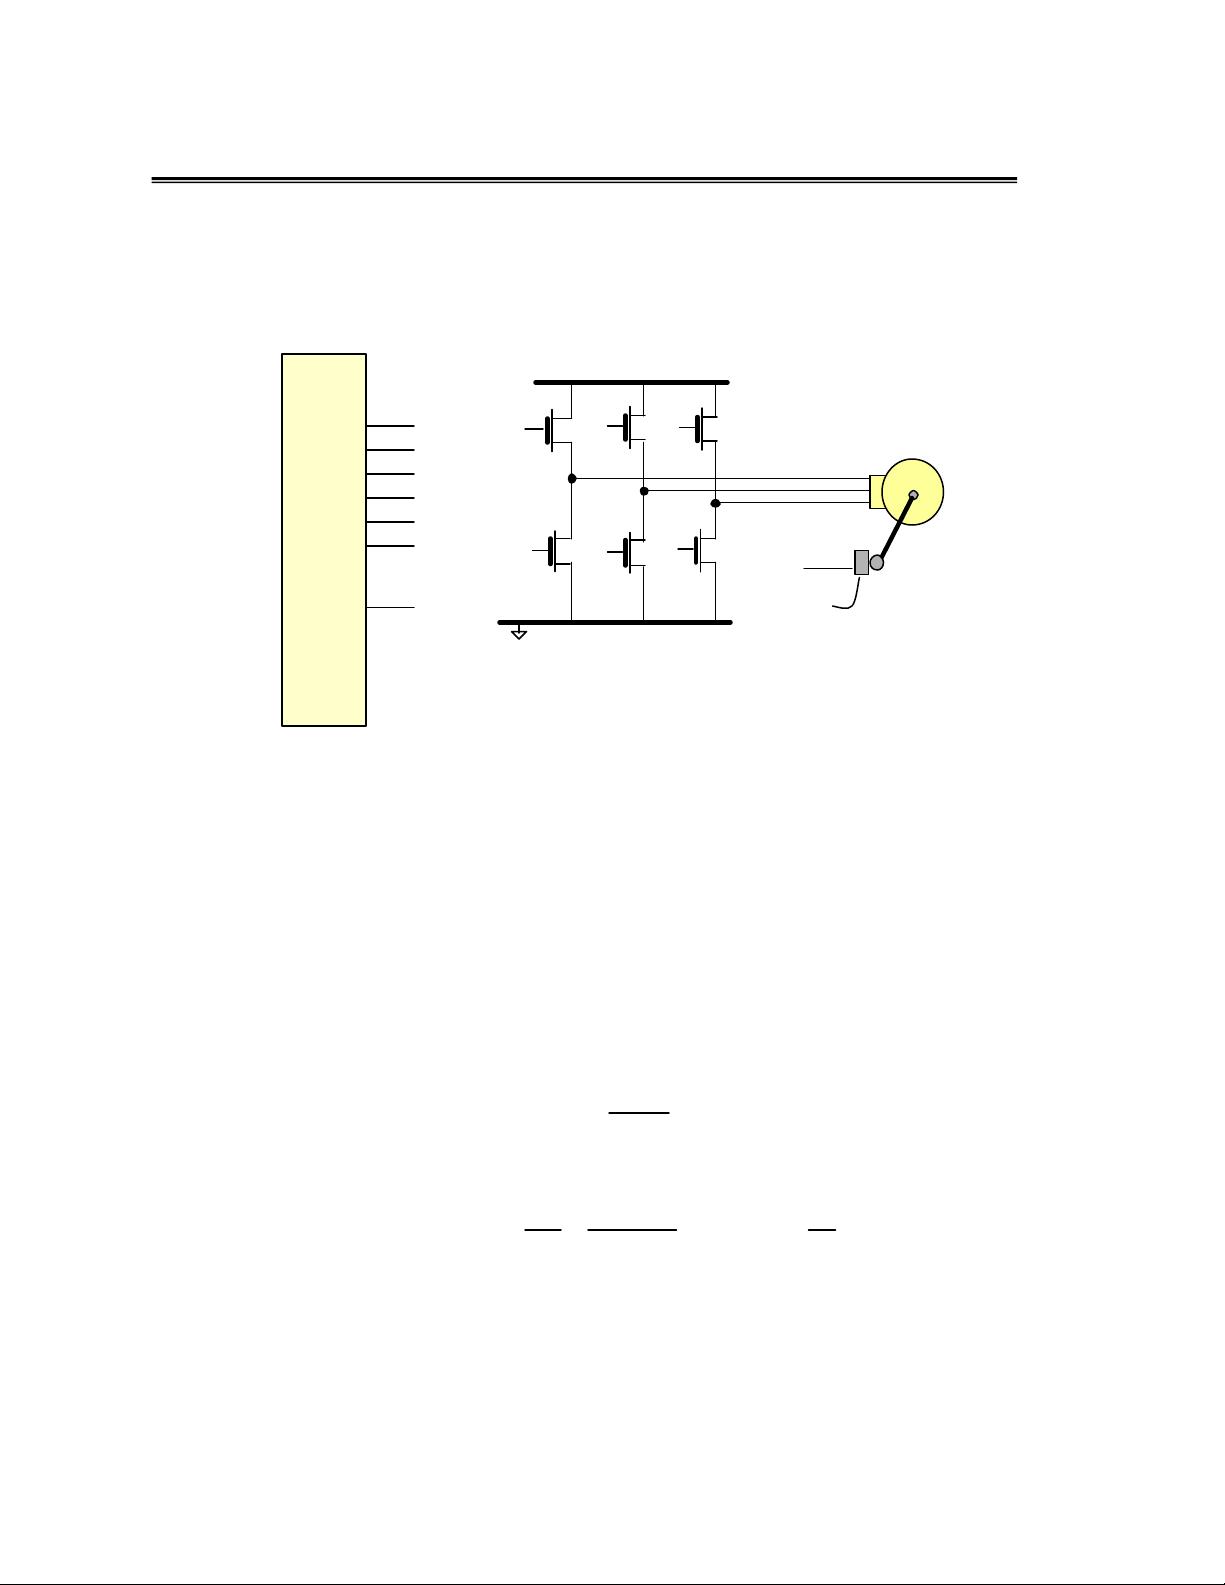
The following diagram shows the complete system diagram for a three phase ACI motor drive. A
three-phase voltage source inverter is utilized to operate a three-phase ACI motor. Six PWM
channels from DSP controller regulate the motor phase voltages by controlling the six power
devices. One capture input is utilized to measure the motor speed.
Figure 1: A 3-ph induction motor drive implementation
In the V/Hz control, the speed of induction motor is controlled by the adjustable both magnitude of
stator voltages and its frequency in such a way that the air gap flux is always maintained at the
desired value at the steady -state. Sometimes this scheme is called the scalar control because it
focuses only on the steady-state dynamic. It can explain how this technique works by looking at
the simplified version of the steady-state equivalent circuit as seen in figure 2. According to in this
figure, the stator resistance (R
s
) is assumed to be zero and the stator leakage inductance (L
ls
) is
embedded into the (referred to stator) rotor leakage inductance (L
lr
) and the magnetizing
inductance, which is representing the amount of air gap flux, is moved in front of the total leakage
inductance (L
l
= L
ls
+ L
lr
). As a result, the magnetizing current that generates the air gap flux can
be approximately the stator voltage to frequency ratio. Its phasor equation (for steady-state
analysis) can be seen as:
m
s
m
Lj
V
~
I
~
ω
≅ (1)
If the induction motor is operating in the linear magnetic region, the L
m
is constant. Then, the
equation (1) can be simply shown in terms of magnitude as:
f
V
L)f2(
V
L
I
s
m
m
s
m
m
m
∝Λ⇒
π
≅
Λ
= (2)
PWM1
PWM2
PWM3
PWM4
PWM5
PWM6
x28xx
DSP
PWM1
PWM2
PWM3
PWM4
PWM5
PWM6
ACI
3 phase
CAP1
CAP1
Tacho

Texas Instruments Inc., March 2003
5
System Overview
s
V
~
m
I
~
m
Ljω
s
R
r
l
Ljω0R
s
≅
Figure 2: Simplified steady-state equivalent circuit of induction motor
In order to keep Λ
m
constant, the ratio of V
s
/f would also be constant at the different speed. As the
speed increases, the stator voltages must, therefore, be proportionally increased in order to keep
the constant ratio of V
s
/f. However, the frequency (or synchronous speed) is not the real speed
because of a slip as a function of the motor load. At no-load torque, the slip is very small, and the
speed is nearly the synchronous speed. Thus, the simple open-loop V
s
/f (or V/Hz) system cannot
precisely control the speed with a presence of load torque. The slip compensation can be simply
added in the system with the speed measurement. The closed-loop V/Hz system with a speed
sensor can be shown in figure 3.
In practice, the stator voltage to frequency ratio is usually based on the rated values of these
variables. The typical V/Hz profile can be shown in figure 3. Basically, there are three speed
ranges in the V/Hz profile as follows:
• At 0-f
c
Hz, the voltage drop across the stator resistance cannot be neglected and must be
compensated by increasing the V
s
. So, the V/Hz profile is not linear. The cutoff frequency (f
c
)
and the suitable stator voltages may be analytically computed from the steady-state
equivalent circuit with R
s
≠ 0.
• At f
c
-f
rated
Hz, it follows the constant V/Hz relationship. The slope actually represents the air
gap flux quantity as seen in equation (2).
• At higher f
rated
Hz, the constant V
s
/f ratio cannot be satisfied because the stator voltages
would be limited at the rated value in order to avoid insulation breakdown at stator windings.
Therefore, the resulting air gap flux would be reduced, and this will unavoidably cause the
decreasing developed torque correspondingly. This region is usually so called “field-
weakening region”.
V
s
(volt)
f
(Hz)f
c
f
rated
V
rated
0
field weakening region
linear region
stator voltage drop
compensation region
Figure 3: Stator voltage versus frequency profile under V/Hz control


