没有合适的资源?快使用搜索试试~ 我知道了~
巴克莱-美股-资产管理-美国经纪人、资产管理人与交易员:Q4丑陋的资产管理背景-19-22页.pdf
需积分: 0 0 下载量 147 浏览量
2023-07-26
11:50:02
上传
评论
收藏 490KB PDF 举报
温馨提示
试读
22页
巴克莱-美股-资产管理-美国经纪人、资产管理人与交易员:Q4丑陋的资产管理背景-19-22页.pdf
资源推荐
资源详情
资源评论
Equity Research
9 January 2019
CORE
Barclays Capital Inc. and/or one of its affiliates does and seeks to do business with
companies covered in its research reports. As a result, investors should be aware that the
firm may have a conflict of interest that could affect the objectivity of this report. Investors
should consider this report as only a single factor in making their investment decision.
PLEASE SEE ANALYST CERTIFICATION(S) AND IMPORTANT DISCLOSURES BEGINNING ON PAGE 17.
U.S. Brokers, Asset Managers & Exchanges
Ugly Asset Mgr. Setup into 4Q Print
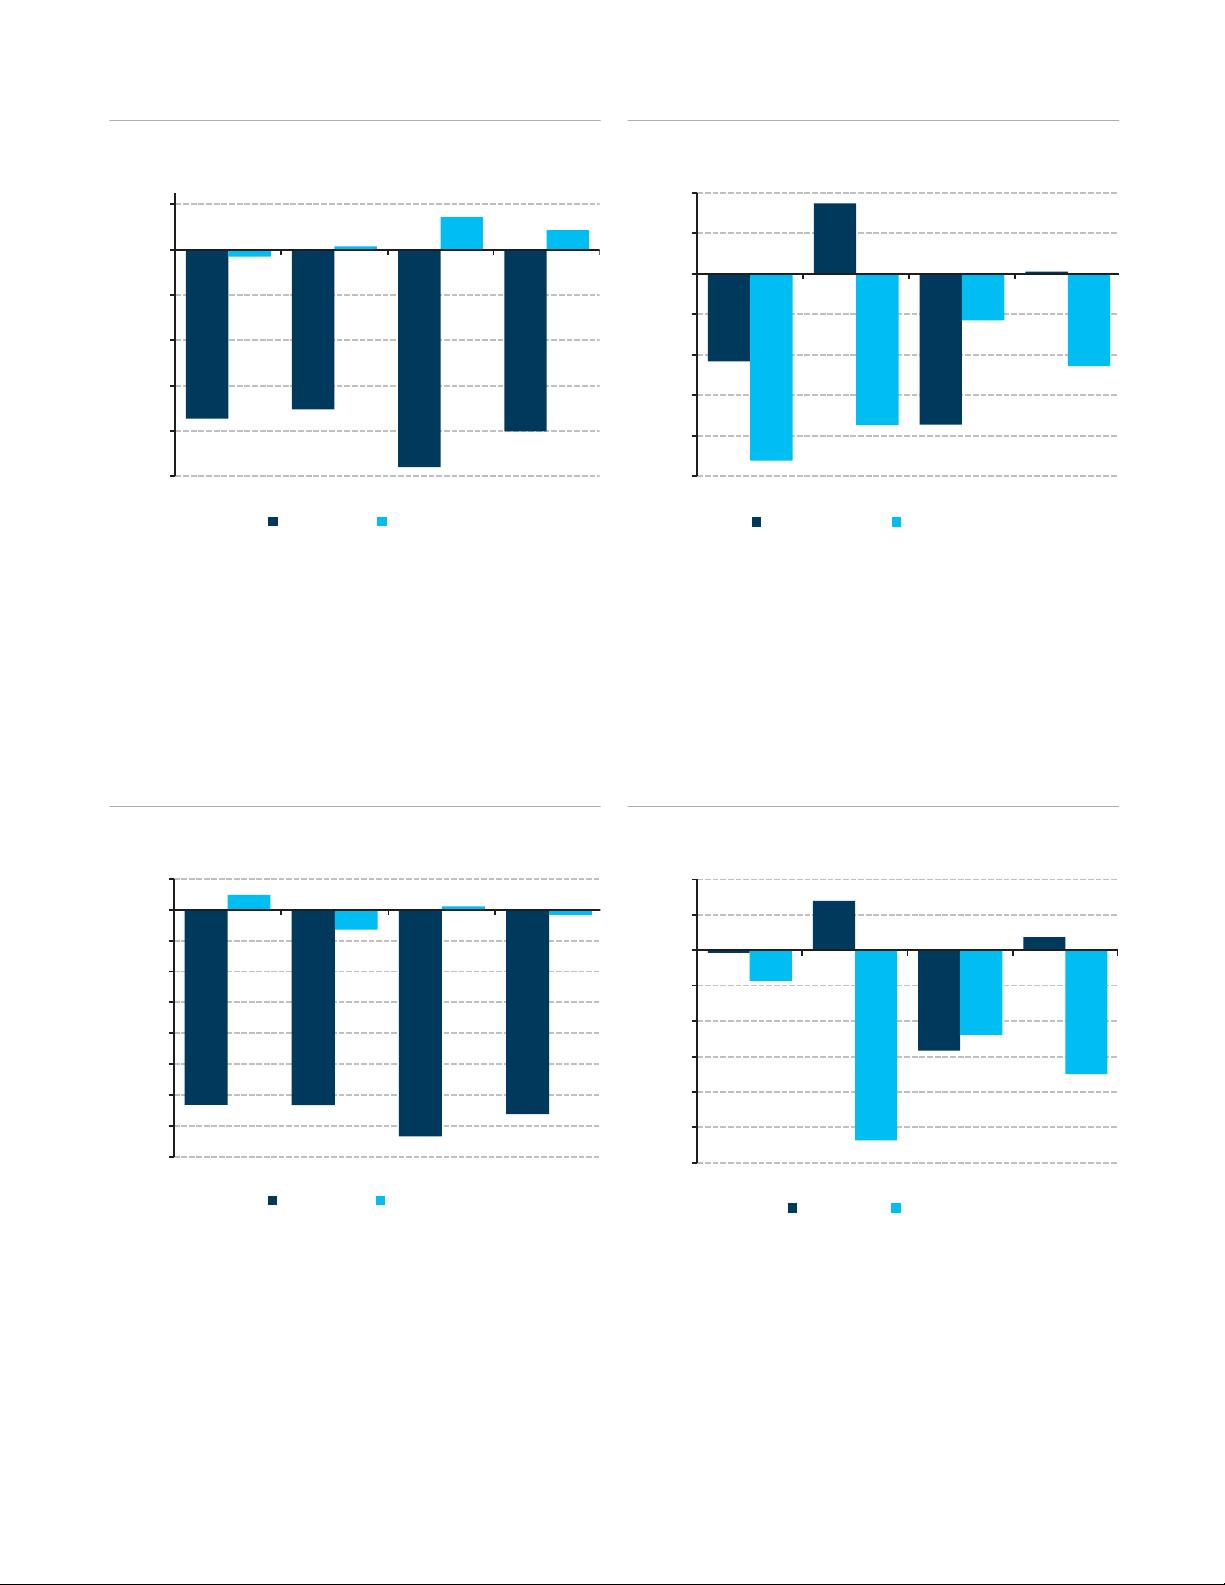
Lower asset manager December Quarter EPS 6-20% from prior forecast. We trace
active management underperformance almost across the board as equity and fixed
income returns were mostly in-line to worse than broad indices (Figure 7). This
underperformance, combined with (likely) outflows drag on AUM & have a negative
fundamental read through to earnings (yielding 1%-10% downward EPS revisions)
while 2
nd
order impacts like weak incentive revenue & fair value marks add additional
weakness (driving additional 3%-18% downward EPS revisions).
AUM/EPS Weakness—qualitatively understood but potential for downside surprise:
In a perfectly efficient market, the impact of a market pullback on AUM/EPS would be
fully reflected in the stock, but we see potential downside risk. The magnitude of the
December AUM decreases (2%-6% below November, Figure 3) could surprise those
that haven’t sharpened pencils as the big market drawdown & sizeable outflows
happened in the latter half of the month when many were already on holiday break.
Additionally, most Street models take a simple average of period-end AUMs to drive
revenue, which would overstate 4Q Avg. AUM & revenues as the sell-off began almost
immediately in October & stayed low thereafter. On balance, fundamentals (weak
flows/performance, etc) drove 1%-10% downward EPS revisions (vs. 6-20% in total).
2
nd
order EPS impacts—hard to model, non-obvious, & possibly large drag on EPS:
Negative marks on Asset Manger seed books and weak incentive fee revenue (in a
typically seasonally strong 4Q) are not top-of-mind modeling adjustments for the sell-
or buy-side, but could have a material impact on the EPS print. Though terribly difficult
to model, our best effort translated to 3%-18% downward earnings revisions for the
quarter vs. our prior forecast (which in addition to the 1%-10% negative fundamental
revision, yielded the total 6%-20% total decrease in December quarter forecasts). Our
line item forecasts are likely off but directionally correct as actual marks/incentive
comp should come in well below prior levels (& seemingly most Street models). We
estimate each $20mm change in performance/incentive revenue (at a ~50% pass
through to incentive comp) and every $10mm change in fair value marks (no opex
offset) translates to a 1%-11% change in EPS for the quarter (see Figure 2 for details).
AM stocks sold off, but don’t fully contemplate fundamental & 2
nd
order weakness:
Although most asset manager stocks drastically sold since November (down 7-15%, vs.
S&P down ~7%), we believe reported December-end AUM levels may be lower than
most anticipate, yielding possible weakness on the monthly AUM prints over the next
week and into earnings (as some may mis-calculate average AUM). Additionally, while
some may view fair value marks on the seed book & weak performance/incentive
revenue as noise, headline misses would certainly not help improve sentiment on a
pretty disliked subsector and could yield additional downside absent a robust rally in
the broad market ahead of Jan/Feb earnings calls.
INDUSTRY UPDATE
U.S. Brokers, Asset Managers & Exchanges
NEUTRAL
Unchanged
For a full list of our ratings, price target and
earnings changes in this report, please see
table on page 2.
U.S. Brokers, Asset Managers & Exchanges
Jeremy Campbell, CFA
+1 212 526 9750
jeremy.campbell@barclays.com
BCI, US
Francesca Kruk
+1 212 526 3856
francesca.kruk@barclays.com
BCI, US
Jason Weber
+ 1 212 526 9406
jason.weber@barclays.com
BCI, US
Ben Jackson
+1 212 526-3006
Ben.Jackson@barclays.com
BCI, US
Barclays | U.S. Brokers, Asset Managers & Exchanges
9 January 2019 2
Summary of our Ratings, Price Targets and Earnings Changes in this Report (all changes are shown in bold)
Company
Rating
Price
Price Target
EPS FY1 (E)
EPS FY2 (E)
Old
New
08-Jan-19
Old
New
%Chg
Old
New
%Chg
Old
New
%Chg
U.S. Brokers, Asset Managers & Exchanges
Neu
Neu
BlackRock, Inc. (BLK)
OW
OW
397.91
450.00
425.00
-6
27.48
26.49
-4
27.85
25.90
-7
Franklin Resources Inc. (BEN)
UW
UW
30.59
25.00
23.00
-8
2.74
2.52
-8
2.87
2.80
-2
Invesco Ltd. (IVZ)
OW
OW
17.28
20.00
19.00
-5
2.61
2.49
-5
2.37
2.16
-9
Legg Mason, Inc. (LM)
EW
EW
26.80
25.00
25.00
-
2.90
2.81
-3
2.87
2.87
-
T. Rowe Price Group, Inc. (TROW)
UW
UW
92.32
88.00
88.00
-
7.36
7.25
-1
7.17
6.58
-8
Virtus Investment Partners, Inc. (VRTS)
EW
EW
82.92
95.00
90.00
-5
12.72
12.57
-1
13.34
12.53
-6
Source: Barclays Research. Share prices and target prices are shown in the primary listing currency and EPS estimates are shown in the reporting currency.
FY1(E): Current fiscal year estimates by Barclays Research. FY2(E): Next fiscal year estimates by Barclays Research.
Stock Rating: OW: Overweight; EW: Equal Weight; UW: Underweight; RS: Rating Suspended
Industry View: Pos: Positive; Neu: Neutral; Neg: Negative
Barclays | U.S. Brokers, Asset Managers & Exchanges
9 January 2019 3
ASSET MANAGER AUM & EARNINGS UNDER PRESSURE
Updated Estimates Reflect Pressured AUM & Negative Marks
EPS Estimates Down 6%-20% from Previous
Since we updated our models in mid-December (2019 Outlook: Seems Like a Make or Break
Year, 12/13/18), the S&P fell an additional ~5.5% before year-end, rendering our (slightly
optimistic) 4Q estimates all but futile. We’ve thus updated our EPS estimates to account for
lower AUM and negative marks on investment income.
FIGURE 1
Asset Manager Estimate Changes and Impact from Negative Marks
Source: Barclays Research, Company Reports
While we applied a blended return rate to what we believe are the assets each company
marks to market, there are many other investments for which we cannot get a good read.
Therefore, in Figure 2 we highlight the EPS impact from each $20mm of additional incentive
fees and $10mm of additional return on investment.
FIGURE 2
Each $10mm of Investment Marks or $20mm of Incentive Fees (~50% opex offset) Could
Drive Significant EPS Moves
Source: Barclays Research, Company Reports
Prior
4Q
New
4Q
D
Prior
1QF19
New
1QF19
D
Prior
4Q
New
4Q
D
Prior
3QF19
New
3QF19
D
Prior
4Q
New 4Q
D
Prior
4Q
New
4Q
D
Fundamentals
Blended Flow Rate 0.4% 0.7% 0.3% (3.6%) (4.7%) (1.1%) (3.2%) (3.5%) (0.3%) (0.6%) 0.8% 1.5% (0.2%) (0.1%) 0.1% (0.4%) (2.6%) (2.2%)
Blended Returns (1.1%) (6.0%) (4.9%) (1.9%) (6.3%) (4.4%) (3.9%) (9.3%) (5.4%) (2.0%) (4.0%) (2.0%) (4.2%) (10.5%) (6.3%) (1.0%) (7.8%) (6.8%)
Long-Term AUM
($bn)
5,932 5,645 (4.8%) 677 638 (5.8%) 837 792 (5.4%) 675 659 (2.3%) 102 93 (9.1%)
Total AUM ($bn) 6,380 6,096 (4.5%) 686 647 (5.7%) 924 879 (4.9%) 735 731 (0.6%) 1,036 968 (6.5%) 104 95 (9.0%)
Average Total AUM
($bn)
6,417 6,252 (2.6%) 702 683 (2.7%) 953 926 (2.8%) 745 740 (0.7%) 1,060 1,024 (3.4%) 105 100 (4.5%)
Blended Fee Rate
(bps)
17.8 17.8 (0.1%) 58.0 58.0 0.0% 43.5 43.5 0.0% 34.1 33.7 (1.0%) 46.6 46.6 0.0% 45.3 45.3 0.0%
Adj. Op Margin 42.6% 42.0% (0.6%) 47.9% 47.0% (0.9%) 35.9% 35.1% (0.8%) 22.5% 21.2% (1.3%) 45.5% 45.2% (0.2%) 36.6% 34.9% (1.6%)
Impact on EPS from
fundamentals
($0.15) (2.3%) ($0.03) (4.2%) ($0.04) (6.9%) ($0.01) (0.9%) ($0.06) (3.5%) ($0.35) (9.9%)
2nd Order Impacts
Incentive Fees ($mm)* 207.0 13.0 (93.7%) 10.0 5.0 (50.0%) 18.0 2.0 (88.9%)
Each $20mm impact
to EPS
($0.05) ($0.02) ($0.08)
Incentive Fee impact ($0.46) ($0.00) ($0.07)
Investment Gain/Loss
(net of NCI) ($mm)
28.2 (50.0) (277.4%) 50.0 (30.0) (160.0%) 8.0 (27.0) (437.5%) 2.0 (6.0) (400.0%) 5.4 (9.5) (275.5%) 0.0 (0.5)
Each $10mm*
impact to EPS
($0.05) ($0.02) ($0.02) ($0.08) ($0.03) ($0.09)
Investment Loss
Impact
($0.37) ($0.09) ($0.07) ($0.07) ($0.04) ($0.04)
2
nd
Order EPS Impact ($0.84) ($0.09) ($0.07) ($0.13) ($0.04) ($0.04)
Revised EPS Estimate $6.60 $5.61 (15.0%) $0.75 $0.63 (15.9%) $0.62 $0.50 (18.5%) $0.75 $0.61 (17.9%) $1.76 $1.66 (6.1%) $3.51 $3.12 (11.2%)
TROW
VRTS
BLK
BEN
IVZ
LM
BLK BEN IVZ LM TROW VRTS
$ Impact to EPS $0.05 $0.02 $0.02 $0.08 $0.03 $0.09
% Impact to EPS 0.7% 2.1% 3.3% 11.3% 1.8% 2.7%
Barclays | U.S. Brokers, Asset Managers & Exchanges
9 January 2019 4
AUM likely down quarter-over-quarter and month-over-month
Ahead of December AUM reports, we update our estimates to reflect just how pressured
AUM may have been in the month given recent market moves. Given what has been
reported QTD, even our upside scenario results in declining AUM.
FIGURE 3
4Q18 AUM Estimates in 3 Different Scenarios
Source: Barclays Research, Company Reports
Our scenarios contemplate the following:
Scenario 1 (Our Updated December-end Base Case)
Returns - we use the weighted average market performance of U.S. retail mutual funds
and ETFs for each asset class as a proxy for performance of that asset class as a whole.
Flows - using the method above to derive returns for October and November, we apply
the combined annualized flow rate to November-end AUM.
Upside Scenario
Returns - we assume equity performance was only -5%, fixed income performance was
+2%, and multi-asset returns were -2% at each manager. For those with alternative
offerings, we use our base case estimate.
Flows - we apply the better of our October and November flow assumptions.
Downside Scenario
Returns - we contemplate -10% returns in equities, hold fixed income returns at 0, and
assume multi-assets were -5%. We again use our base case estimate for alternatives.
Flows - we apply the worse of our October and November flow assumptions.
S&P 500, MSCI Down in December; Asset Manager Returns Follow Suit
Over the course of December alone, the S&P 500 fell ~9% while the MSCI World ex-US was
down nearly 5%, driving negative equity returns at asset managers. Based on the retail
funds for which we can trace performance, IVZ was the only asset manager with aggregate
equity returns beating its index average, as its US equities likely only had negative ~8%
returns and international equities were likely in-line with the MSCI.
On the other hand, from what we can tell each asset manager’s aggregate fixed income
funds underperformed index averages. With the Barclays US Government Bond Index up
2.1% in December, the Barclays Global Aggregate Bond Index up 2%, and the Barclays US
Agg up 1.8%, even the slightly positive returns at most asset managers were considered
underperformance. LM likely had the best performance in the month, fitting considering
over 60% of its AUM is invested in fixed income.
Nov. Long-Term
AUM ($bn)
December-end
AUM Est. ($bn)
% D
Upside Scenario
AUM Estimate ($bn)
% D
Downside Scenario
AUM Estimate ($bn)
% D
BEN 674 637 (5.4%) 656 (2.7%) 625 (7.2%)
IVZ 834 792 (5.1%) 805 (3.5%) 771 (7.6%)
LM 673 659 (2.1%) 673 0.1% 646 (3.9%)
TROW 1,032 969 (6.1%) 996 (3.5%) 946 (8.3%)
Barclays | U.S. Brokers, Asset Managers & Exchanges
9 January 2019 5
FIGURE 4
Aggregate Asset Class Returns in December were Ugly…
FIGURE 5
…But not all were worse than their indices
Source: Barclays Research, Company Reports, Strategic Insight Simfund, Refinitiv
BEN May Have Underperformed the Least in the Quarter, LM the Most
On the whole, each of the asset managers for whom we have a read on AUM
underperformed their respective indices in the quarter. That said, BEN may have
underperformed the least on aggregate, mainly thanks to equity returns. While we only
have a read on ~50% of BEN’s AUM, we believe its US equity returns were only -12.2% in
the quarter (vs. the S&P 500’s -14%) though its international equity returns were -12.2%,
compared to the MSCI’s -11.8%.
FIGURE 6
Quarterly Returns were also very negative…
FIGURE 7
…With most underperforming their indices
Source: Barclays Research, Company Reports, Strategic Insight Simfund, Refinitiv
It’s likely LM underperformed indices the most, as both its US & international equities
missed benchmarks. While we only have a read on ~20% of LM’s AUM, we believe it had
equity returns in the quarter of -14.7% (vs. a -13.3% blended average of the S&P & MSCI
based on LM’s equity AUM breakdown) and fixed income returns of +0.2%, below the
+1.4% blended average of the Barclays US Government Bond Index (+2.5%), Barclays Global
Agg (+1.2%) and Barclays US Agg (+1.6%).
(10%)
(8%)
(6%)
(4%)
(2%)
0%
2%
BEN
IVZ
LM
TROW
Equity
Fixed Income
(2.5%)
(2.0%)
(1.5%)
(1.0%)
(0.5%)
0.0%
0.5%
1.0%
BEN
IVZ
LM
TROW
Equity
Fixed Income
(16%)
(14%)
(12%)
(10%)
(8%)
(6%)
(4%)
(2%)
0%
2%
BEN
IVZ
LM
TROW
Equity
Fixed Income
(3.0%)
(2.5%)
(2.0%)
(1.5%)
(1.0%)
(0.5%)
0.0%
0.5%
1.0%
BEN
IVZ
LM
TROW
Equity
Fixed Income
剩余21页未读,继续阅读
资源评论
2201_75761617
- 粉丝: 18
- 资源: 7339
上传资源 快速赚钱
- 我的内容管理 展开
- 我的资源 快来上传第一个资源
- 我的收益 登录查看自己的收益
- 我的积分 登录查看自己的积分
- 我的C币 登录后查看C币余额
- 我的收藏
- 我的下载
- 下载帮助
安全验证
文档复制为VIP权益,开通VIP直接复制
信息提交成功