没有合适的资源?快使用搜索试试~ 我知道了~
JP 摩根-美股-航空航天与国防行业-Q3航空航天与国防行业预览与更新--37页.pdf
需积分: 0 0 下载量 81 浏览量
2023-07-24
16:38:15
上传
评论
收藏 1.08MB PDF 举报
温馨提示
![preview](https://dl-preview.csdnimg.cn/88086868/0001-872e765a2582b71ee2747c69274e9371_thumbnail.jpeg)
![preview-icon](https://csdnimg.cn/release/downloadcmsfe/public/img/scale.ab9e0183.png)
试读
37页
JP 摩根-美股-航空航天与国防行业-Q3航空航天与国防行业预览与更新--37页.pdf
资源推荐
资源详情
资源评论
![pdf](https://img-home.csdnimg.cn/images/20210720083512.png)
![rar](https://img-home.csdnimg.cn/images/20210720083606.png)
![pdf](https://img-home.csdnimg.cn/images/20210720083512.png)
![zip](https://img-home.csdnimg.cn/images/20210720083736.png)
![](https://csdnimg.cn/release/download_crawler_static/88086868/bg1.jpg)
Aerospace & Defense
Seth M. Seifman
AC
(212) 622-5597
seth.m.seifman@jpmorgan.com
JPMA SEIFMAN <GO>
J.P. Morgan Securities LLC
North America Equity Research
October 2019
See the end pages of this presentation for analyst certification and important disclosures, including non-US analyst disclosures.
J.P. Morgan does and seeks to do business with companies covered in its research reports. As a result, investors should be aware that the firm may
have a conflict of interest that could affect the objectivity of this report. Investors should consider this report as only a single factor in making their
investment decision.
Aerospace and Defense
Q3 Preview and Industry Update
Ben Arnstein
(212) 622-6548
benjamin.e.arnstein@jpmorgan.com
Michael Rednor
(212) 622-1110
michael.s.rednor@jpmorgan.com
![](https://csdnimg.cn/release/download_crawler_static/88086868/bg2.jpg)
2
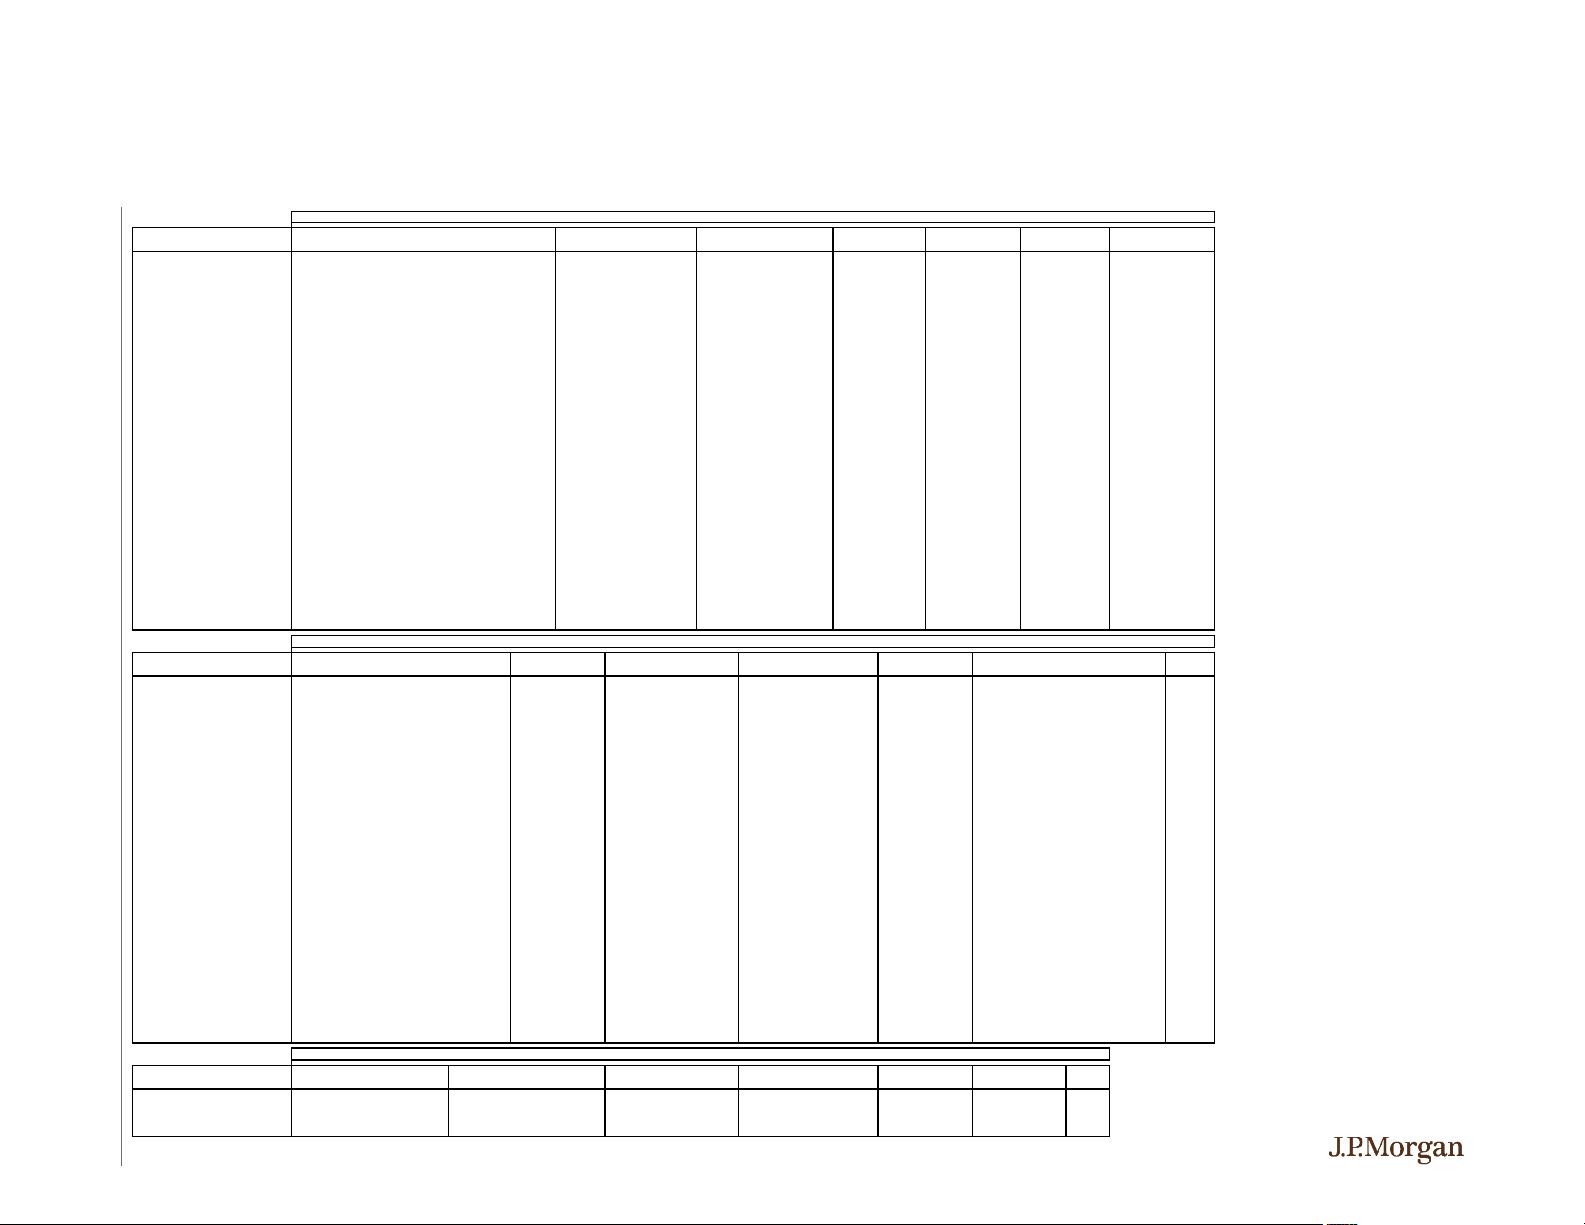
J.P. Morgan Aero/Def Comp Sheet
Source: Bloomberg, J.P. Morgan. Note: Prices as of October 11, 2019.
Shares Mark et EP S P/E EV/ EB ITDA EV/ Sales P/FCF Price Implied
Company
Price
Symbol
Rating
Out
Cap (bn)
CY1 8
CY1 9E
CY2 0E
CY1 8
CY1 9E
CY2 0E
CY1 9E
CY2 0E
CY1 9E
CY2 0E
CY19E
CY2 0E
Target
Ups ide
Aerospace/Integrated
Arconic $26.45 ARNC OW 445.3 11.8 1.34 2.05 2.45 19.8x 12.9x 10.8x 7.0x 6.5x 1.1x 1.1x 15.9x 14.5x $30 13%
Boeing $374.92 BA OW 564.7 211.7 16.06 2.65 20.30 23.3x NM 18.5x 44.9x 12.4x 2.8x 1.9x NM 12.3x $425 13%
Bombardier C$ 1.57 BBD/B CT N 2901.5 3.4 0.13 (0.07) 0.04 9.5x NM NM 5.6x 6.4x 0.6x 0.6x NM 11.4x na na
Kaman Corp $58.24 KAMN UW 28.1 1.6 2.88 1.90 2.30 20.3x 30.6x 25.3x 17.9x 16.1x 1.8x 2.4x 28.5x 27.6x $63 8%
Spirit A eroSystems $83.50 SPR N 104.5 8.7 6.24 6.95 8.10 13.4x 12.0x 10.3x 8.0x 7.1x 1.2x 1.1x 12.7x 12.4x $100 20%
Textron $48.86 TXT OW 233.5 11.4 3.35 3.80 4.10 14.6x 12.9x 11.9x 8.6x 8.4x 1.1x 1.0x 15.7x 14.8x $58 19%
TransDigm $524.78 TDG UW 56.3 29.5 16.07 19.90 22.72 32.6x 26.4x 23.1x 18.6x 15.5x 7.3x 7.0x 23.0x 23.6x $590 12%
Triumph Group $21.26 TGI N 50.3 1.1 2.05 2.80 2.98 10.4x 7.6x 7.1x 9.6x 7.9x 0.8x 0.9x NM NM $30 41%
$279
18.0x
17.1x
15.3x
15.0x
10.1x
2.1x
2.0x
19.1x
16.7x
Defense (Large Cap)
Ge neral Dynamics $179.63 GD N 290.8 52.2 11.22 11.90 13.00 16.0x 15.1x 13.8x 12.0x 11.4x 1.7x 1.6x 14.2x 14.1x $215 20%
Huntington Ingalls $211.74 HII N 41.7 8.8 19.08 14.15 15.75 11.1x 15.0x 13.4x 10.4x 9.0x 1.1x 1.1x 17.6x 16.1x $255 20%
L3 Harris Technologies $208.94 LHX OW 224.1 46.8 8.02 9.66 11.35 26.1x 21.6x 18.4x 16.7x 14.2x 2.9x 2.7x 17.7x 17.9x $235 12%
Lo ckheed Martin $381.47 LMT N 283.9 108.3 17.59 21.60 25.35 21.7x 17.7x 15.0x 12.5x 11.5x 2.0x 1.9x 17.4x 17.0x $395 4%
Northrop Grumman $362.22 NOC OW 170.3 61.7 19.50 19.90 23.75 18.6x 18.2x 15.3x 15.7x 14.3x 2.2x 2.1x 21.5x 18.6x $375 4%
Raytheon $198.72 RTN OW 279.9 55.6 10.14 11.90 12.45 19.6x 16.7x 16.0x 10.8x 10.1x 2.0x 1.9x 18.3x 15.3x $230 16%
$333
18.8x
17.4x
15.3x
12.8x
11.7x
2.0x
1.9x
17.8x
16.5x
Defense Services
Booz Allen Hamilton $71.48 BAH N 141.1 10.1 2.64 3.07 3.58 27.1x 23.3x 20.0x 17.2x 15.2x 1.7x 1.6x 25.7x 23.5x $77 8%
CACI International $229.79 CA CI N 25.3 5.8 10.41 10.06 12.93 22.1x 22.8x 17.8x 16.0x 12.7x 1.5x 1.3x 11.7x 14.8x $250 9%
Le id os $83.16 LDOS N 146.0 12.1 4.39 4.70 5.25 19.0x 17.7x 15.9x 13.6x 12.7x 1.3x 1.3x 17.2x 15.2x $95 14%
Scie nce Applications International $84.56 SAIC OW 59.1 5.0 4.73 5.45 6.35 17.9x 15.5x 13.3x 12.7x 11.6x 1.1x 1.0x 11.7x 10.5x $102 21%
$33
21.5x
19.8x
16.7x
14.9x
13.0x
1.4x
1.3x
16.6x
16.0x
Defense (Smid Cap)
Aerojet Rocketdyne
b
$47.95 AJRD N 80.7 3.9 1.79 1.85 1.81 26.8x 25.9x 26.5x 11.7x 11.7x 1.9x 1.8x 21.7x 20.6x $52 8%
Kratos $18.82 KT OS OW 109.4 2.1 0.23 0.34 0.47 81.2x 55.7x 39.8x 28.4x 23.6x 3.0x 2.6x 139.1x 74.1x $25 33%
Maxar Technologies
b
$7.14 MAXR OW 59.6 0.4 (21.76) 0.78 (1.22) NM 9.1x NM 6.8x 6.9x 1.8x 1.8x NM NM $12 68%
Mercury Systems $75.59 MRCY OW 54.1 4.1 1.63 1.89 2.25 46.5x 40.0x 33.6x 24.3x 21.5x 5.4x 4.9x 62.3x 42.3x $80 6%
Average/Total:
$10
51.5x
32.7x
33.3x
17.8x
15.9x
3.0x
2.8x
74.4x
45.7x
S&P 500 (Consensus) $2,970 SPX 146.62 164.77 182.74 20.3x 18.0x 16.3x
A & D discount/(premium)
9%
4%
6%
JPM Consensus JPM Cons ensus FCF (per s hare) Sales (bn) Operating Margin Dividend Payout Market Net Debt / YTD
Company FY1 EPS FY1 EPS FY2 EPS FY2 EPS CY1 9E CY2 0E CY1 8 CY1 9E CY2 0E CY18 CY1 9E CY20E Yi eld Ratio '19 Cap '19 EBITDA Return
Aerospace/Integrated
Arconic 2.05 2.04 2.45 2.36 1.66 1.83 14.0 14.4 14.8 9.5% 8.1% 12.8% 0.3% 3.9% 11.8 4.4 16.2 1.9x 58%
Boeing 2.65 3.96 20.30 23.05 (1.55) 30.49 101.1 79.2 116.5 11.9% 3.9% 13.4% 2.2% 310.6% 211.7 9.6 221.3 2.0x 18%
Bombardier
a
(0.06) (0.10) 0.04 0.07 (0.18) 0.14 16.2 16.7 17.6 6.2% 7.7% 6.0% 0.0% 0.0% 3.4 6.4 9.8 3.6x -23%
Kaman Corp 1.90 1.75 2.30 2.17 2.05 2.11 1.9 1.0 0.8 4.4% 7.9% 8.5% 1.4% 42.1% 1.6 0.3 1.9 2.5x 5%
Spirit A eroSystems 6.95 6.81 8.10 7.63 6.57 6.72 7.2 7.9 8.4 11.7% 12.1% 12.9% 0.6% 6.9% 8.7 0.8 9.6 0.7x 16%
Textron 3.75 3.74 4.10 3.98 3.12 3.29 14.0 13.8 14.3 8.2% 9.0% 8.9% 0.2% 2.1% 11.4 3.1 14.6 1.9x 6%
TransDigm 22.10 21.69 24.85 24.82 22.86 22.22 4.0 6.0 6.2 43.6% 34.9% 40.8% 0.0% 0.0% 29.5 14.2 43.7 6.0x 63%
Triumph Group 2.65 2.55 2.95 3.16 (0.21) 0.08 3.4 2.9 2.8 NM -8.2% 7.2% 0.8% 5.7% 1.1 1.4 2.5 5.5x 86%
161.8
142.0
181.4
13.6%
9.4%
13.8%
0.7%
46.4%
24%
Defense Primes
Ge neral Dynamics 11.90 11.87 13.00 13.07 12.63 12.71 36.2 39.3 41.1 12.3% 11.8% 12.0% 2.3% 34.3% 52.2 13.2 65.5 2.4x 17%
Huntington Ingalls 14.15 13.96 15.75 16.83 12.03 13.19 8.2 8.8 9.2 11.6% 9.0% 10.1% 1.6% 24.3% 8.8 1.2 10.0 1.2x 13%
L3 Harris Technologies 8.15 9.67 5.00 11.14 11.82 11.65 16.6 18.1 19.2 14.8% 13.0% 14.5% 1.4% 31.0% 46.8 5.4 52.2 1.7x 57%
Lo ckheed Martin 21.60 21.23 25.35 25.39 21.88 22.42 53.8 59.5 63.2 13.6% 14.3% 14.7% 2.3% 40.7% 108.3 12.4 120.7 1.3x 49%
Northrop Grumman 19.90 19.66 23.75 22.52 16.87 19.44 30.1 34.0 36.2 12.6% 11.1% 11.8% 1.3% 24.1% 61.7 12.8 74.4 2.7x 50%
Raytheon 11.90 11.58 12.45 12.83 10.86 13.00 27.1 29.0 31.0 16.8% 16.7% 16.8% 1.9% 31.7% 55.6 2.9 58.5 0.5x 32%
171.8
188.7
199.8
13.6%
12.6%
13.3%
1.8%
31.0%
41%
Defense Services
Booz Allen Hamilton 3.20 3.10 3.70 3.49 2.79 3.04 6.2 6.7 7.4 8.4% 9.0% 9.2% 1.3% 30.0% 10.1 1.5 11.6 2.2x 60%
CACI International 12.35 12.18 13.55 13.63 19.71 15.53 4.5 5.0 5.6 7.6% 8.5% 8.8% 0.0% 0.0% 5.8 1.6 7.4 3.4x 60%
Le id os 4.70 4.71 5.25 5.23 4.84 5.46 10.2 10.8 11.4 7.3% 7.7% 8.4% 1.6% 28.9% 12.1 2.4 14.5 2.2x 60%
Scie nce Applications International 5.45 5.52 6.35 6.16 7.22 8.09 4.7 6.4 6.7 4.7% 5.8% 6.6% 1.8% 27.1% 5.0 1.9 6.9 3.5x 35%
25.5
29.0
31.1
7.0%
7.7%
8.3%
1.2%
21.5%
Defense (Smid Cap)
Aerojet Rocketdyne
b
1.85 1.86 1.81 1.93 2.21 2.33 1.9 2.0 2.0 14.3% 12.7% 12.1% 0.0% 0.0% 3.9 (0.1) 3.8 (0.3x) 36%
Kratos 0.34 0.28 0.47 0.46 0.14 0.25 0.6 0.7 0.8 4.9% 5.1% 4.8% 0.0% 0.0% 2.1 0.1 2.2 1.5x 34%
Maxar Technologies
b
0.78 0.29 (1.22) 0.42 (0.51) (0.05) 2.1 2.0 1.9 1.1% 5.6% 6.7% 0.6% 5.1% 0.4 3.1 3.5 6.0x -40%
Mercury Systems 2.10 2.07 2.27 2.31 1.21 1.79 0.6 0.7 0.8 9.5% 11.7% 12.3% 0.0% 0.0% 4.1 (0.3) 3.8 (1.6x) 60%
Average/Total:
5.2
5.4
5.6
7.5%
8.8%
9.0%
0.1%
1.3%
S&P 500
2.0%
20%
Pension Adjus tments
Pension Adjusted EPS (PAEPS) P/PAEPS EB ITDAP (bn) EV /EBITDAP Pension Adj FCF P/PAFCF
Company
CY1 8
CY1 9E
CY2 0E
CY1 8
CY1 9E
CY2 0E
CY1 8
CY1 9E
CY2 0E
CY18
CY1 9E
CY2 0E
CY1 9E
CY2 0E
CY1 9E
CY20E
Huntington Ingalls 12.51 11.28 14.17 16.9x 18.8x 14.9x 0.8 0.8 1.0 12.1x 12.1x 10.2x 6.16 9.75 34.4x 21.7x $15
Lo ckheed Martin 14.83 17.82 18.85 25.7x 21.4x 20.2x 6.7 7.6 8.0 18.0x 15.8x 15.1x 12.84 14.93 29.7x 25.5x $26
Northrop Grumman 12.13 14.33 16.43 29.9x 25.3x 22.0x 4.0 4.3 4.7 18.8x 17.1x 15.8x 12.77 15.43 28.4x 23.5x $20
Raytheon
9.60
9.82
10.78
20.7x
20.2x
18.4x
3.7
4.0
4.3
15.9x
14.7x
13.7x
5.21
7.57
38.1x
26.2x
$24
Notes: J.P. Morgan ratings: OW = Overweight; N = Neutral; UW = Underweight ; NR = Not Rated. Price targets for Dec 31, 2020. SAIC FY ends in Jan.; T GI and BAH FY ends in March; CACI, HRS and MRCY end June; T DG ends Sept.
a. BBD stock price in C$ converted based on current exchange rate to calculate ratios. b. AJRD and MAXR are covered by Ben Arnstein. All EPS calculations consistent with Bloomberg consensus. Sources: Bloomberg, company reports, and J.P. Morgan estimates.
Valuation Metrics
Other Financial Metrics
Ne t Debt
EV
Pension
NPV
![](https://csdnimg.cn/release/download_crawler_static/88086868/bg3.jpg)
3
October Balance of Power Rankings and 3Q19 Earnings Picks
Company Symbol Rating Points Price Notes
Arconic ARNC OW 150 $26.45 Recently upgraded; looking for beat and raise w/ split details
Booz Allen BAH N 145 $71.48 Our 79c estimate is high on the Street; bookings likely solid
Raytheon RTN OW 140 $198.72 Still see a low bar into Q3 earnings
Huntington Ingalls HII N 135 $211.74 Margin stabilization should be good enough
TransDigm TDG UW 130 $524.78 Expect solid quarter in Nov, little MAX exposure
L3Harris LHX OW 125 $208.94 Little concern on financials; sentiment already positive though
Spirit AeroSystems SPR N 120 $83.50 SPR should show margin improvement in Q3
Mercury Systems MRCY OW 115 $75.59 Solid organic growth can drive outperformance
Triumph Group TGI N 110 $21.26 In line results should be good enough with TGI in low $20s
Bombardier BBD/B N 105 $1.57 High risk pick but expectations are very low
General Dynamics GD N 100 $179.63 Valuation, sentiment set up well but Gulfstream backlog is a risk
SAIC SAIC OW 100 $84.56 Read-throughs from other service co's could help; reports in Dec
CACI International CACI N 95 $229.79 We are modestly below consensus
Northrop Grumman NOC OW 90 $362.22 Performance likely to depend on appetite for safe havens
Maxar Technologies MAXR OW 85 $7.14 Plenty of risk in MAXR's print but expectations are very low
Textron TXT OW 80 $48.86 Kautex dilution is emerging headwind for 2020
Aerojet Rocketdyne AJRD N 75 $47.95 We're not expecting a dramatic beat or miss
Lockheed Martin LMT N 70 $381.47 Cash flow outlook may fall short of investor expectations
Kratos KTOS OW 65 $18.82 Quarterly results opaque; milestones more likely to drive stock
Boeing BA OW 60 $374.92
At $375 into earnings, BA needs firmer details on MAX return; upside risk from news
on China order
Leidos LDOS N 55 $83.16 Key contract risks muddy the outlook, especially Hanford
Kaman Corp KAMN UW 50 $58.24 We see M&A focus as a risk
Total 2,200
Source: J.P. Morgan
![](https://csdnimg.cn/release/download_crawler_static/88086868/bg4.jpg)
4
Traffic Remains at the Low End of OK
YTD traffic growth (thru Aug) is 4.5%, below IATA’s 5% estimate for 2019 (revised down from 6% at 6/30)
Three regions really matter: Asia-Pac (~35% of total); Europe (~27%) and North America (~23%)
Comps slightly easier rest of year; JPM forecasts 2.7% GDP growth for 2019 so traffic looking like 1.6x
Asia has decelerated to 5% vs high single digits in recent years
China is > 1/3 of Asia and has slowed from ~15% to 10%; rest of Asia is anemic
Europe has punched above its weight, given low GDP growth but shows signs of slowing
North America has decelerated ~100 bps but acts like the mature market it is at 3-4%
Source (both): IATA, CAAC.
Europe slowing after punching way above its weight
(3 mo MA)
China slower but still growing; Asia ex is anemic
(3 mo MA)
0%
1%
2%
3%
4%
5%
6%
7%
8%
9%
Dec-17
Jan-18
Feb-18
Mar-18
Apr-18
May-18
Jun-18
Jul-18
Aug-18
Sep-18
Oct-18
Nov-18
Dec-18
Jan-19
Feb-19
Mar-19
Apr-19
May-19
Jun-19
Jul-19
Aug-19
0.0%
2.0%
4.0%
6.0%
8.0%
10.0%
12.0%
14.0%
16.0%
Jul-18 Aug-18Sep-18 Oct-18 Nov-18 Dec-18 Jan-19 Feb-19 Mar-19 Apr-19 May-19Jun-19 Jul-19 Aug-19
Asia Growth China Growth Implied Rest of Asia
![](https://csdnimg.cn/release/download_crawler_static/88086868/bg5.jpg)
5
Business Jets: Bombardier Deliveries Look Light
Source: Cirium, J.P. Morgan Estimates.
Bombardier shows shortfall: Challenger 350 is light; transition may have affected Global 5000/6000
We lowered out Longitude estimate but there is little impact on earnings
Gulfstream is best house, but the end market is a bad neighborhood
Cirium JPMe ∆
Bombardier
Learjet 70/75 2 4 (2)
Challenger 350 10 14 (4)
Challenger 650 5 6 (1)
Global 5000/6000 6 11 (5)
Global 7500 3 4 (1)
Total 26 39 (13)
General Dynamics
Gulfstream G280 9 7 2
Gulfstream G500 5 7 (2)
Gulfstream G550 5 4 1
Gulfstream G600 4 3 1
Gulfstream G650 15 15 0
Total 38 36 2
Textron
Citation M2 7 8 (1)
CitationJet CJ3 10 10 0
CitationJet CJ4 8 8 0
Citation XLS 6 5 1
Citation Latitude 15 15 0
Citation Sovereign 2 1 1
Citation Longitude 1 1 0
Total 49 48 1
剩余36页未读,继续阅读
资源评论
![avatar-default](https://csdnimg.cn/release/downloadcmsfe/public/img/lazyLogo2.1882d7f4.png)
![avatar](https://profile-avatar.csdnimg.cn/default.jpg!1)
![avatar-vip](https://csdnimg.cn/release/downloadcmsfe/public/img/user-vip.1c89f3c5.png)
2201_75761617
- 粉丝: 21
- 资源: 7339
上传资源 快速赚钱
我的内容管理 展开
我的资源 快来上传第一个资源
我的收益
登录查看自己的收益我的积分 登录查看自己的积分
我的C币 登录后查看C币余额
我的收藏
我的下载
下载帮助
![voice](https://csdnimg.cn/release/downloadcmsfe/public/img/voice.245cc511.png)
![center-task](https://csdnimg.cn/release/downloadcmsfe/public/img/center-task.c2eda91a.png)
安全验证
文档复制为VIP权益,开通VIP直接复制
![dialog-icon](https://csdnimg.cn/release/downloadcmsfe/public/img/green-success.6a4acb44.png)