


Prediction of Finger Flexion
4
th
Brain-Computer Interface Data Competition
Kai J. Miller
1,2
and Gerwin Schalk
3,4,5
1
Department of Physics, University of Washington, Seattle, Washington
2
Program in Neurobiology and Behavior, University of Washington, Seattle, Washington
3
Wadsworth Center, New York State Department of Health, Albany, New York
4
Department of Neurology, Albany Medical College, Albany, New York
5
Department of Neurosurgery, Washington University in St. Louis, St. Louis, Missouri
(Dated: June 11, 2008)
The goal of this element of the competition is to predict the flexion of individual fingers from
signals recorded from the surface of the brain (electrocorticography (ECoG)). This data set contains
brain signals from three subjects, as well as the time courses of the flexion of each of five fingers.
The task in this competition is to use the provided flexion information in order to predict finger
flexion for a provided test set. The performance of the classifier will be evaluated by calculating the
average correlation coefficient r between actual and predicted finger flexion.
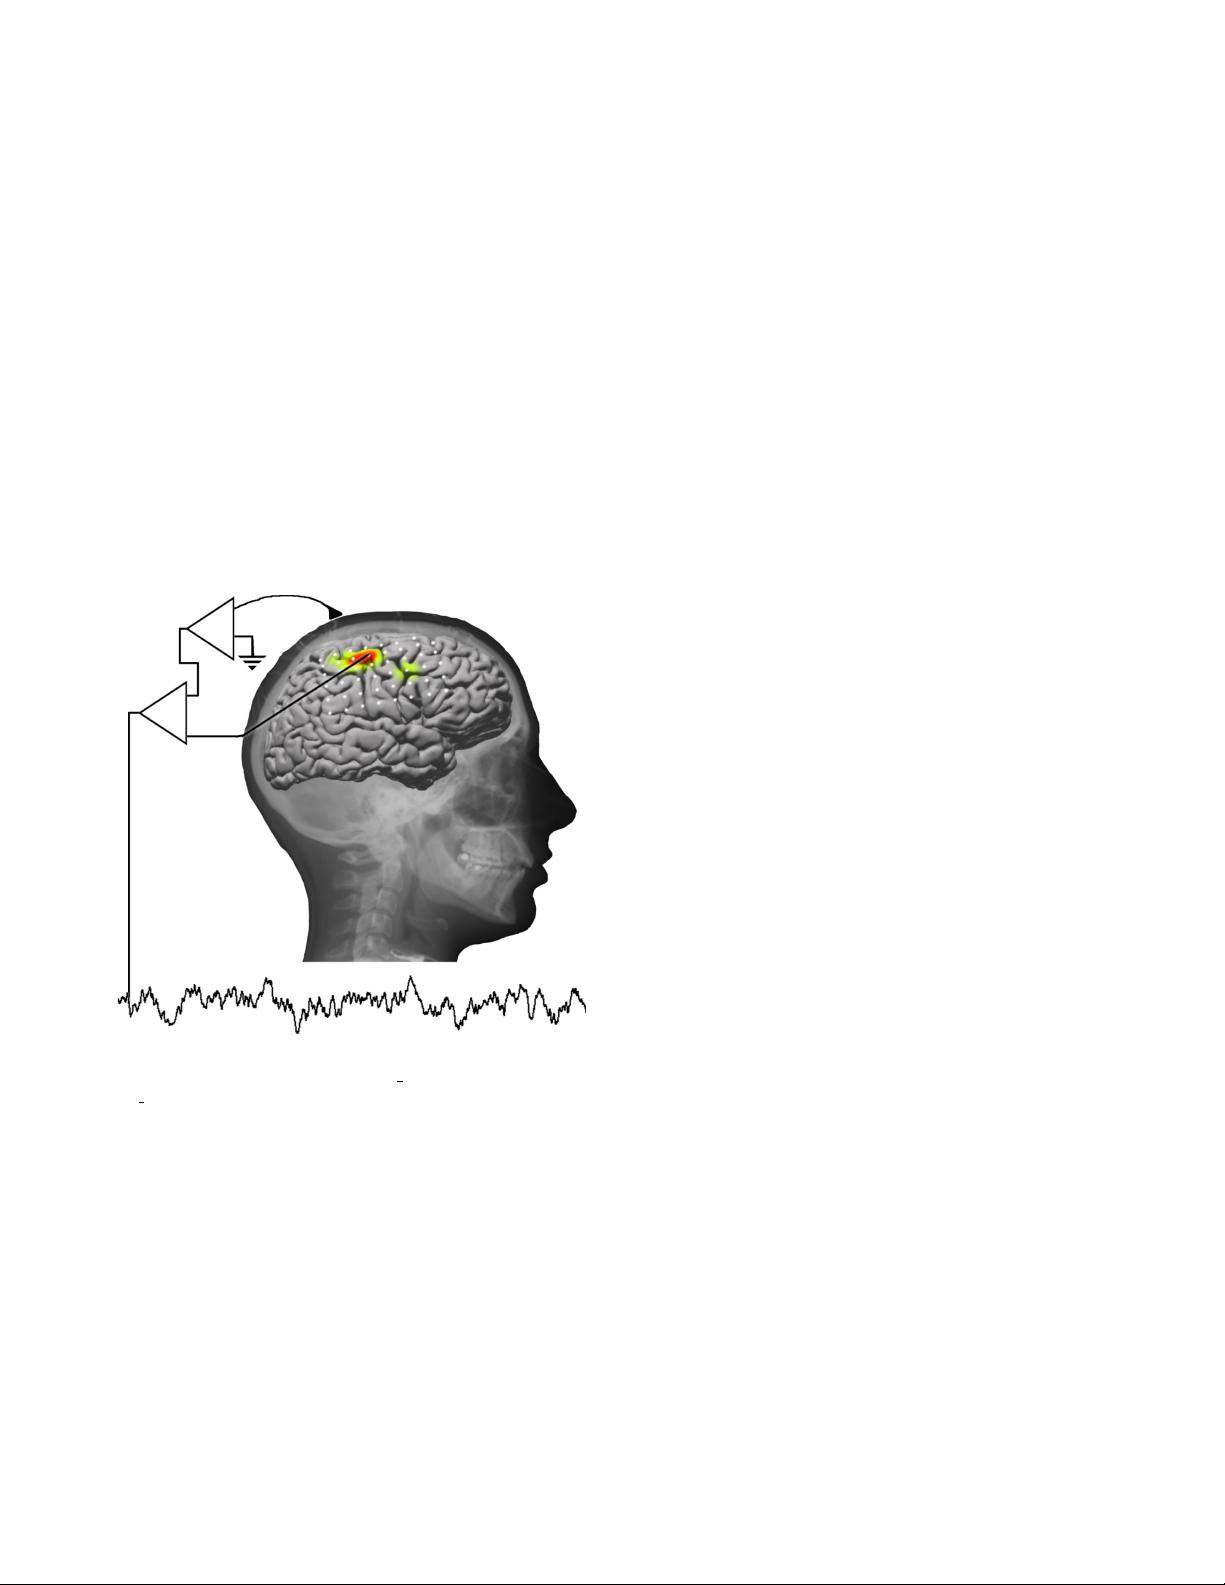
FIG. 1: ECoG signals in train data(time,channel) and
test data(time,channel) were acquired from each electrode
with respect to a scalp reference and ground before re-
referencing with respect to the common average.
I. SUBJECTS
The three subjects in the data set were epileptic pa-
tients at Harborview Hospital in Seattle, Washington.
Each patient had electrode grids placed subdurally on
the surface of the brain for the purpose of extended clini-
cal monitoring and localization of seizure foci. Each sub-
ject gave informed consent to participate in this study,
which was approved by the internal review board (IRB)
of Harborview Hospital. All patient data have been
anonymized according to IRB protocol in accordance
with HIPAA regulations.
II. RECORDINGS
Signals from the electrode grid were amplified and dig-
itized using Synamps2 amplifiers (Neuroscan, El Paso,
TX). The general-purpose BCI system BCI2000 [1] pro-
vided visual stimuli to the patient, acquired brain sig-
nals from the Synamps2 system, and also recorded the
flexion of individual fingers (on the hand contralateral
to the implanted grid) using a data glove (Fifth Dimen-
sion Technologies, Irvine, CA). BCI2000 stored the brain
signals, the timing of stimulus presentation, and the flex-
ion of each of the fingers in a data file. Data files were
converted to Matlab format for this competition. Each
patient had subdural electrode arrays (Ad-Tech, Racine,
WI) implanted. Each array contained 48-64 platinum
electrodes that were configured in 8x6 or 8x8 arrange-
ments. The electrodes had a diameter of 4 mm (2.3mm
exposed), 1 cm inter-electrode distance, and were em-
bedded in silastic. Electrocorticographic (ECoG) signals
(i.e., 62, 48, and 64 channels from subjects 1, 2, and 3,
respectively) were acquired with respect to a scalp ref-
erence and ground (Fig. 1), band pass filtered between
0.15 to 200 Hz, and sampled at 1000 Hz.
III. EXPERIMENTAL PROTOCOL
The subjects were cued to move a particular finger by
displaying the corresponding word (e.g., ”thumb”) on a
computer monitor placed at the bed-side (Fig. 2). Each
cue lasted two seconds and was followed by a two-second
rest period during which the screen was blank. During
each cue, the subjects typically moved the requested fin-
ger 3-5 times. This number varied across subjects and
fingers. There were 30 movement stimulus cues for each
finger (i.e., a total of 150 cue presentations and about
90-150 flexions of each finger); stimulus cues were inter-
leaved randomly. This experiment lasted 10 minutes for
each subject.
Subsequent offline analysis showed that ring (4
th
) fin-


