没有合适的资源?快使用搜索试试~ 我知道了~
资源推荐
资源详情
资源评论
Mean Shift: A Robust Approach
Toward Feature Space Analysis
Dorin Comaniciu, Member, IEEE, and Peter Meer, Senior Member, IEEE
AbstractÐA general nonparametric technique is proposed for the analysis of a complex multimodal feature space and to delineate
arbitrarily shaped clusters in it. The basic computational module of the technique is an old pattern recognition procedure, the mean
shift. We prove for discrete data the convergence of a recursive mean shift procedure to the nearest stationary point of the underlying
density function and, thus, its utility in detecting the modes of the density. The relation of the mean shift procedure to the Nadaraya-
Watson estimator from kernel regression and the robust M-estimators of location is also established. Algorithms for two low-level vision
tasks, discontinuity preserving smoothing and image segmentation, are described as applications. In these algorithms, the only user
set parameter is the resolution of the analysis and either gray level or color images are accepted as input. Extensive experimental
results illustrate their excellent performance.
Index TermsÐMean shift, clustering, image segmentation, image smoothing, feature space, low-level vision.
æ
1INTRODUCTION
L
OW-LEVEL computer vision tasks are misleadingly diffi-
cult. Incorrect results can be easily obtained since the
employed techniques often rely upon the user correctly
guessing the values for the tuning parameters. To improve
performance, the execution of low-level tasks should be task
driven, i.e., supported by independent high-level informa-
tion. This approach, however, requires that, first, the low-
level stage provides a reliable enough representation of the
input and that the feature extraction process be controlled
only by very few tuning parameters corresponding to
intuitive measures in the input domain.
Feature space-based analysis of images is a paradigm
which can achieve the above-stated goals. A feature space is
a mapping of the input obtained through the processing of
the data in small subsets at a time. For each subset, a
parametric representation of the feature of interest is
obtained and the result is mapped into a point in the
multidimensional space of the parameter. After the entire
input is processed, significant features correspond to denser
regions in the feature space, i.e., to clusters, and the goal of
the analysis is the delineation of these clusters.
The nature of the feature space is application dependent.
The subsets employed in the mapping can range from
individual pixels, as in the color space representation of an
image, to a set of quasi-randomly chosen data points, as in
the probabilistic Hough transform. Both the advantage and
the disadvantage of the feature space paradigm arise from
the global nature of the derived representation of the input.
On one hand, all the evidence for the presence of a
significant feature is pooled together, providing excellent
tolerance to a noise level which may render local decisions
unreliable. On the other hand, features with lesser support
in the feature space may not be detected in spite of being
salient for the task to be executed. This disadvantage,
however, can be largely avoided by either augmenting the
feature space with additional (spatial) parameters from the
input domain or by robust postprocessing of the input
domain guided by the results of the feature space analysis.
Analysis of the feature space is application independent.
While there are a plethora of published clustering techni-
ques, most of them are not adequate to analyze feature
spaces derived from real data. Methods which rely upon
a priori knowledge of the number of clusters present
(including those which use optimization of a global
criterion to find this number), as well as methods which
implicitly assume the same shape (most often elliptical) for
all the clusters in the space, are not able to handle the
complexity of a real feature space. For a recent survey of
such methods, see [29, Section 8].
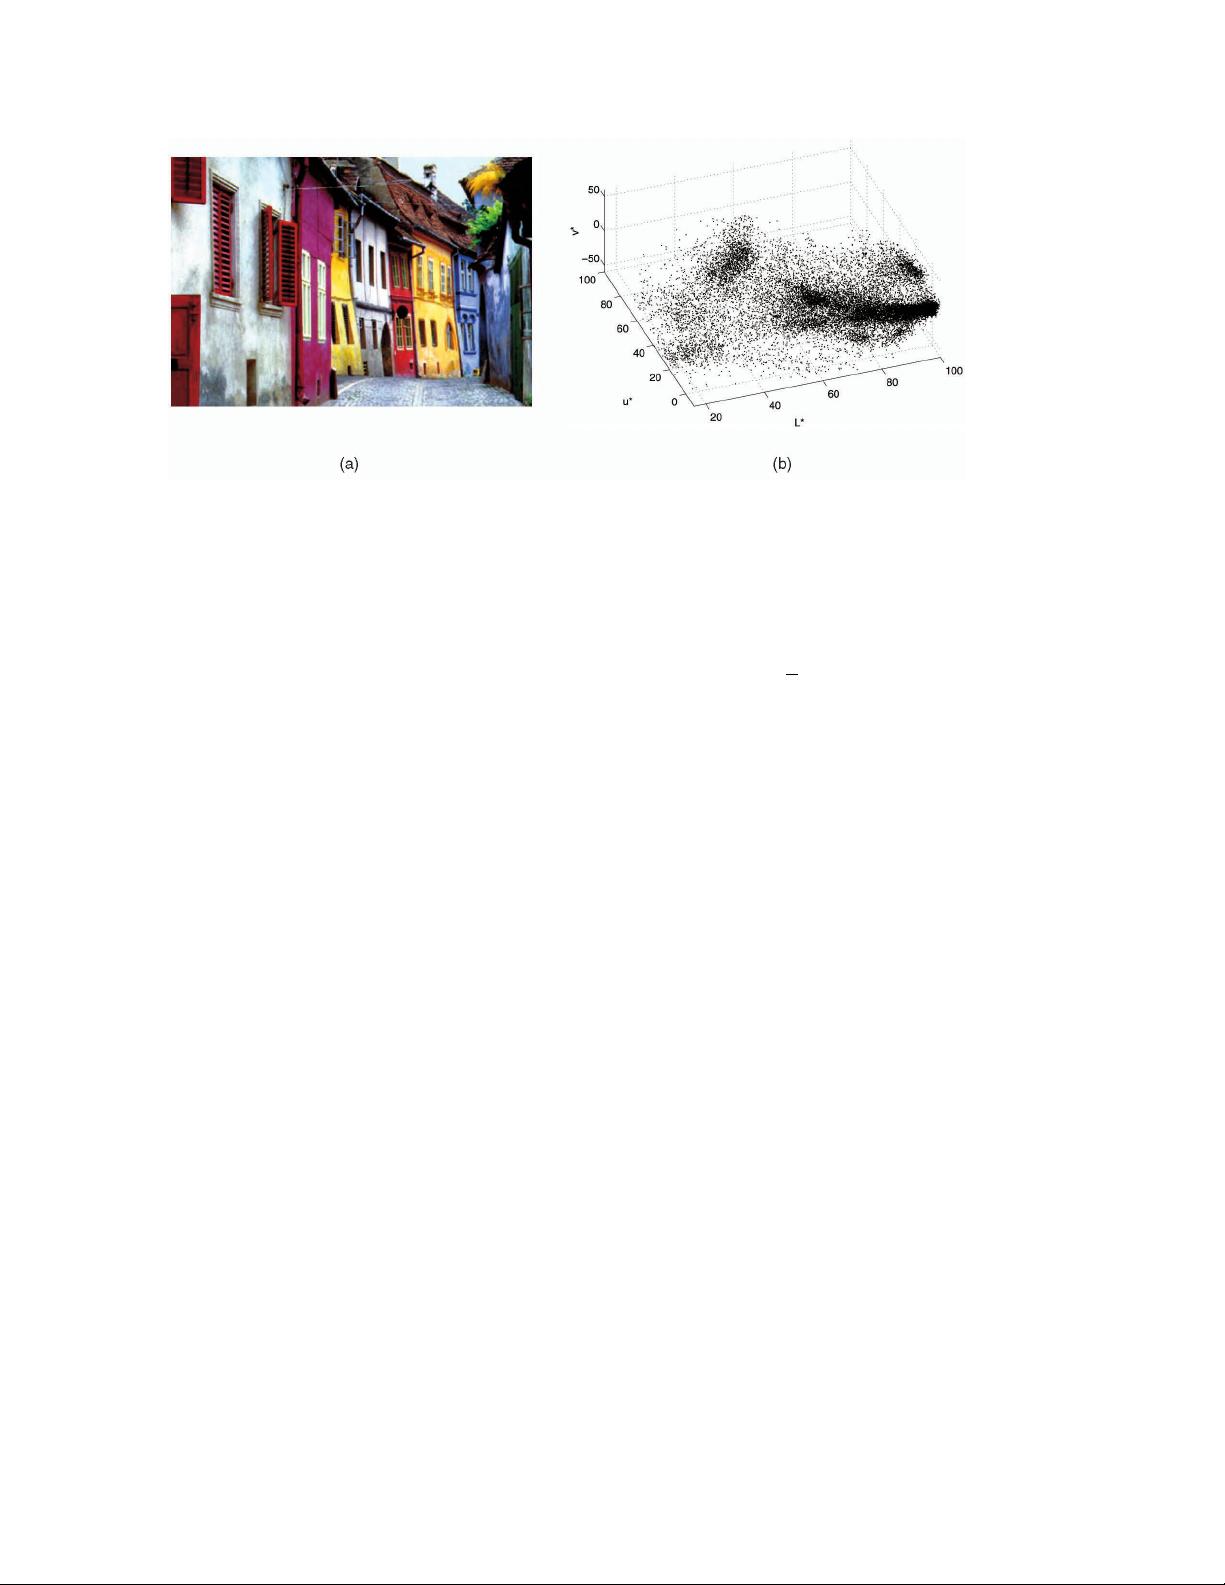
In Fig. 1, a typical example is shown. The color image in
Fig. 1a is mapped into the three-dimensional L*u*v* color
space (to be discussed in Section 4). There is a continuous
transition between the clusters arising from the dominant
colors and a decomposition of the space into elliptical tiles
will introduce severe artifacts. Enforcing a Gaussian
mixture model over such data is doomed to fail, e.g., [49],
and even the use of a robust approach with contaminated
Gaussian densities [67] cannot be satisfactory for such
complex cases. Note also that the mixture models require
the number of clusters as a parameter, which raises its own
challenges. For example, the method described in [45]
proposes several different ways to determine this number.
Arbitrarily structured feature spaces can be analyzed
only by nonparametric methods since these methods do not
have embedded assumptions. Numerous nonparametric
clustering methods were described in the literature and
they can be classified into two large classes: hierarchical
clustering and density estimation. Hierarchical clustering
techniques either aggregate or divide the data based on
IEEE TRANSACTIONS ON PATTERN ANALYSIS AND MACHINE INTELLIGENCE, VOL. 24, NO. 5, MAY 2002 603
. D. Comaniciu is with the Imaging and Visualization Department, Siemens
Corporate Research, 755 College Road East, Princeton, NJ 08540.
E-mail: comanici@scr.siemens.com.
. P. Meer is with the Electrical and Computer Engineering Department,
Rutgers University, 94 Brett Road, Piscataway, NJ 08854-8058.
E-mail: meer@caip.rutgers.edu.
Manuscript received 17 Jan. 2001; revised 16 July 2001; accepted 21 Nov.
2001.
Recommended for acceptance by V. Solo.
For information on obtaining reprints of this article, please send e-mail to:
tpami@computer.org, and reference IEEECS Log Number 113483.
0162-8828/02/$17.00 ß 2002 IEEE
some proximity measure. See [28, Section 3.2] for a survey
of hierarchical clustering methods. The hierarchical meth-
ods tend to be computationally expensive and the definition
of a meaningful stopping criterion for the fusion (or
division) of the data is not straightforward.
The rationale behind the density estimation-based non-
parametric clustering approach is that the feature space can
be regarded as the empirical probability density function
(p.d.f.) of the represented parameter. Dense regions in the
feature space thus correspond to local maxima of the p.d.f.,
that is, to the modes of the unknown density. Once the
location of a mode is determined, the cluster associated
with it is delineated based on the local structure of the
feature space [25], [60], [63].
Our approach to mode detection and clustering is based on
the mean shift procedure, proposed in 1975 by Fukunaga and
Hostetler [21] and largely forgotten until Cheng's paper [7]
rekindled interest in it. In spite of its excellent qualities, the
mean shift procedure does not seem to be known in statistical
literature. While the book [54, Section 6.2.2] discusses [21], the
advantages of employing a mean shift type procedure in
density estimation were only recently rediscovered [8].
As will be proven in the sequel, a computational module
based on the mean shift procedure is an extremely versatile
tool for feature space analysis and can provide reliable
solutions for many vision tasks. In Section 2, the mean shift
procedure is defined and its properties are analyzed. In
Section 3, the procedure is used as the computational
module for robust feature space analysis and implementa-
tional issues are discussed. In Section 4, the feature space
analysis technique is applied to two low-level vision tasks:
discontinuity preserving filtering and image segmentation.
Both algorithms can have as input either gray level or color
images and the only parameter to be tuned by the user is
the resolution of the analysis. The applicability of the mean
shift procedure is not restricted to the presented examples.
In Section 5, other applications are mentioned and the
procedure is put into a more general context.
2THE MEAN SHIFT PROCEDURE
Kernel density estimation (known as the Parzen window
technique in pattern recognition literature [17, Section 4.3]) is
the most popular density estimation method. Given n data
points x
i
, i 1; ...;n in the d-dimensional space R
d
, the
multivariate kernel density estimator with kernel Kx and a
symmetric positive definite d d bandwidth matrix H,
computed in the point x is given by
^
fx
1
n
X
n
i1
K
H
x x
i
; 1
where
K
H
xjH j
1=2
KH
1=2
x: 2
The d-variate kernel Kx is a bounded function with
compact support satisfying [62, p. 95]
Z
R
d
Kxdx 1 lim
kxk!1
kxk
d
Kx0
Z
R
d
xKxdx 0
Z
R
d
xx
>
Kxdx c
K
I;
3
where c
K
is a constant. The multivariate kernel can be
generated from a symmetric univariate kernel K
1
x in two
different ways
K
P
x
Y
d
i1
K
1
x
i
K
S
xa
k;d
K
1
kxk; 4
where K
P
x is obtained from the product of the univariate
kernels and K
S
x from rotating K
1
x in R
d
, i.e., K
S
x is
radially symmetric. The constant a
1
k;d
R
R
d
K
1
kxkdx
assures that K
S
x integrates to one, though this condition
can be relaxed in our context. Either type of multivariate
kernel obeys (3), but, for our purposes, the radially
symmetric kernels are often more suitable.
We are interested only in a special class of radially
symmetric kernels satisfying
Kxc
k;d
kkxk
2
; 5
in which case it suffices to define the function kx called
the profile of the kernel, only for x 0. The normalization
constant c
k;d
, which makes Kx integrate to one, is
assumed strictly positive.
Using a fully parameterized H increases the complexity
of the estimation [62, p. 106] and, in practice, the bandwidth
matrix H is chosen either as diagonal H diagh
2
1
; ...;h
2
d
,
604 IEEE TRANSACTIONS ON PATTERN ANALYSIS AND MACHINE INTELLIGENCE, VOL. 24, NO. 5, MAY 2002
Fig. 1. Example of a feature space. (a) A 400 276 color image. (b) Corresponding L*u*v* color space with 110; 400 data points.
or proportional to the identity matrix H h
2
I. The clear
advantage of the latter case is that only one bandwidth
parameter h>0 must be provided; however, as can be seen
from (2), then the validity of an Euclidean metric for the
feature space should be confirmed first. Employing only
one bandwidth parameter, the kernel density estimator (1)
becomes the well-known expression
^
fx
1
nh
d
X
n
i1
K
x x
i
h
: 6
The quality of a kernel density estimator is measured by
the mean of the square error between the density and its
estimate, integrated over the domainofdefinition. In practice,
however, only an asymptotic approximation of this measure
(denoted as AMISE) can be computed. Under the asympto-
tics, the number of data points n !1, while the bandwidth
h!0 at a rate slower than n
1
. For both types of multivariate
kernels, the AMISE measure is minimized by the Epanechni-
kov kernel [51, p. 139], [62, p. 104] having the profile
k
E
x
1 x 0 x 1
0 x>1;
7
which yields the radially symmetric kernel
K
E
x
1
2
c
1
d
d 21 kxk
2
kxk1
0 otherwise;
8
where c
d
is the volume of the unit d-dimensional sphere.
Note that the Epanechnikov profile is not differentiable at
the boundary. The profile
k
N
xexp
1
2
x
x 0 9
yields the multivariate normal kernel
K
N
x2
d=2
exp
1
2
kxk
2
10
for both types of composition (4). The normal kernel is often
symmetrically truncated to have a kernel with finite support.
While these two kernels will suffice for most applications
we are interested in, all the results presented below are valid
for arbitrary kernels within the conditions to be stated.
Employing the profile notation, the density estimator (6) can
be rewritten as
^
f
h;K
x
c
k;d
nh
d
X
n
i1
k
x x
i
h
2
: 11
The first step in the analysis of a feature space with the
underlying density fx is to find the modes of this density.
The modes are located among the zeros of the gradient
rfx0 and the mean shift procedure is an elegant way
to locate these zeros without estimating the density.
2.1 Density Gradient Estimation
The density gradient estimator is obtained as the gradient of
the density estimator by exploiting the linearity of (11)
^
rf
h;K
xr
^
f
h;K
x
2c
k;d
nh
d2
X
n
i1
x x
i
k
0
x x
i
h
2
:
12
We define the function
gxk
0
x; 13
assuming that the derivative of the kernel profile k exists for
all x 20; 1, except for a finite set of points. Now, using
gx for profile, the kernel Gx is defined as
Gxc
g;d
g kxk
2
; 14
where c
g;d
is the corresponding normalization constant. The
kernel Kx was called the shadow of Gx in [7] in a slightly
different context. Note that the Epanechnikov kernel is the
shadow of the uniform kernel, i.e., the d-dimensional unit
sphere, while the normal kernel and its shadow have the same
expression.
Introducing gx into (12) yields,
^
rf
h;K
x
2c
k;d
nh
d2
X
n
i1
x
i
xg
x x
i
h
2
2c
k;d
nh
d2
X
n
i1
g
x x
i
h
2
"#
P
n
i1
x
i
g
xx
i
h
2
P
n
i1
g
xx
i
h
2
x
2
4
3
5
;
15
where
P
n
i1
g
xx
i
h
2
is assumed to be a positive number.
This condition is easy to satisfy for all the profiles met in
practice. Both terms of the product in (15) have special
significance. From (11), the first term is proportional to the
density estimate at x computed with the kernel G
^
f
h;G
x
c
g;d
nh
d
X
n
i1
g
x x
i
h
2
: 16
The second term is the mean shift
m
h;G
x
P
n
i1
x
i
g
xx
i
h
2
P
n
i1
g
xx
i
h
2
x; 17
i.e., the difference between the weighted mean, using the
kernel G for weights, and x, the center of the kernel
(window). From (16) and (17), (15) becomes
^
rf
h;K
x
^
f
h;G
x
2c
k;d
h
2
c
g;d
m
h;G
x; 18
yielding
m
h;G
x
1
2
h
2
c
^
rf
h;K
x
^
f
h;G
x
: 19
The expression (19) shows that, at location x, the mean shift
vector computed with kernel G is proportional to the normal-
ized density gradient estimate obtained with kernel K. The
normalization is by the density estimate in x computed with
the kernel G. The mean shift vector thus always points toward
the direction of maximum increase in the density. This is a
more general formulation of the property first remarked by
Fukunaga and Hostetler [20, p. 535], [21], and discussed in [7].
The relation captured in (19) is intuitive, the local mean is
shifted toward the region in which the majority of the
COMANICIU AND MEER: MEAN SHIFT: A ROBUST APPROACH TOWARD FEATURE SPACE ANALYSIS 605
points reside. Since the mean shift vector is aligned with the
local gradient estimate, it can define a path leading to a
stationary point of the estimated density. The modes of the
density are such stationary points. The mean shift procedure,
obtained by successive
. computation of the mean shift vector m
h;G
x,
. translation of the kernel (window) Gx by m
h;G
x,
is guaranteed to converge at a nearby point where the estimate
(11) has zero gradient, as will be shown in the next section. The
presence of the normalization by the density estimate is a
desirable feature. The regions of low-density values are of no
interest for the feature space analysis and, in such regions, the
mean shift steps are large. Similarly, near local maxima the
steps are small and the analysis more refined. The mean shift
procedure thus is an adaptive gradient ascent method.
2.2 Sufficient Condition for Convergence
Denote by fy
j
g
j1;2...
the sequence of successive locations of
the kernel G, where, from (17),
y
j1
P
n
i1
x
i
g
xx
i
h
2
P
n
i1
g
xx
i
h
2
j 1; 2; ... 20
is the weighted mean at y
j
computed with kernel G and y
1
is the center of the initial position of the kernel. The
corresponding sequence of density estimates computed
with kernel K, f
^
f
h;K
jg
j1;2...
, is given by
^
f
h;K
j
^
f
h;K
y
j
j 1; 2...: 21
As stated by the following theorem, a kernel K that obeys
some mild conditions suffices for the convergence of the
sequences fy
j
g
j1;2...
and f
^
f
h;K
jg
j1;2...
.
Theorem 1. If the kernel K has a convex and monotonically
decreasing profile, the sequences y
j
j1;2...
and
f
^
f
h;K
jg
j1;2...
converge and f
^
f
h;K
jg
j1;2...
is monotoni-
cally increasing.
The proof is given in the Appendix. The theorem
generalizes the result derived differently in [13], where K
was the Epanechnikov kernel and G the uniform kernel. The
theorem remains valid when each data point x
i
is associated
with a nonnegative weight w
i
. An example of nonconver-
gence when the kernel K is not convex is shown in [10, p. 16].
The convergence property of the mean shift was also
discussed in [7, Section iv]. (Note, however, that almost all the
discussion there is concerned with the ªblurringº process in
which the input is recursively modified after each mean shift
step.) The convergence of the procedure as defined in this
paperwasattributedin [7]to the gradient ascentnature of (19).
However, as shown in [4, Section 1.2], moving in the direction
of the local gradient guarantees convergence only for
infinitesimal steps. The step size of a gradient-based algo-
rithm is crucial for the overall performance. If the step size is
toolarge,thealgorithmwilldiverge,while ifthestepsizeistoo
small, the rate of convergence may be very slow. A number of
costly procedures have been developed for step size selection
[4, p. 24]. The guaranteed convergence (as shown by
Theorem 1) is due to the adaptive magnitude of the mean
shift vector, which also eliminates the need for additional
procedures to chose the adequate step sizes. This is a major
advantage over the traditional gradient-based methods.
For discrete data, the number of steps to convergence
depends on the employed kernel. When G is the uniform
kernel, convergence is achieved in a finite number of steps
since the number of locations generating distinct mean
values is finite. However, when the kernel G imposes a
weighting on the data points (according to the distance
from its center), the mean shift procedure is infinitely
convergent. The practical way to stop the iterations is to set
a lower bound for the magnitude of the mean shift vector.
2.3 Mean Shift-Based Mode Detection
Let us denote by y
c
and
^
f
c
h;K
^
f
h;K
y
c
the convergence
points of the sequences fy
j
g
j1;2...
and f
^
f
h;K
jg
j1;2...
,
respectively. The implications of Theorem 1 are the following.
First, the magnitude of the mean shift vector converges to
zero. Indeed, from (17) and (20) the jth mean shift vector is
m
h;G
y
j
y
j1
y
j
22
and, at the limit, m
h;G
y
c
y
c
y
c
0. In other words, the
gradient of the density estimate (11) computed at y
c
is zero
r
^
f
h;K
y
c
0; 23
due to (19). Hence, y
c
is a stationary point of
^
f
h;K
. Second,
since f
^
f
h;K
jg
j1;2...
is monotonically increasing, the mean
shift iterations satisfy the conditions required by the Capture
Theorem [4, p. 45], which states that the trajectories of such
gradient methods are attracted by local maxima if they are
unique (within a small neighborhood) stationary points.
That is, once y
j
gets sufficiently close to a mode of
^
f
h;K
, it
converges to it. The set of all locations that converge to the
same mode defines the basin of attraction of that mode.
The theoretical observations from above suggest a
practical algorithm for mode detection:
. Run the mean shift procedure to find the stationary
points of
^
f
h;K
,
. Prune these points by retaining only the local
maxima.
The local maxima points are defined, according to the
Capture Theorem, as unique stationary points within some
small open sphere. This property can be tested by
perturbing each stationary point by a random vector of
small norm and letting the mean shift procedure converge
again. Should the point of convergence be unchanged (up to
a tolerance), the point is a local maximum.
2.4 Smooth Trajectory Property
The mean shift procedure employing a normal kernel has
an interesting property. Its path toward the mode follows a
smooth trajectory, the angle between two consecutive mean
shift vectors being always less than 90 degrees.
Using the normal kernel (10), the jth mean shift vector is
given by
m
h;N
y
j
y
j1
y
j
P
n
i1
x
i
exp
xx
i
h
2
P
n
i1
exp
xx
i
h
2
y
j
: 24
The following theorem holds true for all j 1; 2; ...,
according to the proof given in the Appendix.
606 IEEE TRANSACTIONS ON PATTERN ANALYSIS AND MACHINE INTELLIGENCE, VOL. 24, NO. 5, MAY 2002
剩余16页未读,继续阅读
资源评论
- ysc7032013-12-05下载了很长时间的资料,偶尔看了一下,确实不错啊
- xiaozonglook2014-04-06总结的很不错
- 飞翔的可爱猪2013-05-14蛮不错的,值得看
huzhengpeny
- 粉丝: 0
- 资源: 1
上传资源 快速赚钱
- 我的内容管理 展开
- 我的资源 快来上传第一个资源
- 我的收益 登录查看自己的收益
- 我的积分 登录查看自己的积分
- 我的C币 登录后查看C币余额
- 我的收藏
- 我的下载
- 下载帮助
安全验证
文档复制为VIP权益,开通VIP直接复制
信息提交成功