


© 2009 Imatest LLC
Imatest Documentation
1 of 451

Imatest Documentation
Image Quality
An overview of the key image quality factors and how they are measured by Imatest
Sharpness - What is it and how is it measured?
Introduction - The Slanted-edge test - Calculation details - Results - Interpreting MTF50
SQF - Subjective Quality Factor
Introduction - SQF and MTF - Meaning of SQF - Measuring SQF - The SQF equation - CSF - Links
Noise in photographic images
Introduction - Appearance - Noise measurements - Noise summary - F-stop noise - The mathematics of noise - Links
Sharpening - Why standardized sharpening is needed for comparing cameras
Standardized sharpening - Examples
Sharpness comparisons - for several digital cameras
Introduction - Explanation of results - Tables of results - Interpretation of MTF - Some observations - Links
Chromatic Aberration - AKA Color fringing
Introduction - Measurement - Demosaicing
Veiling glare (Lens flare)
Introduction - Target - Measurement - Results - ISO 9358
Color correction matrix
Introduction - Math - Multicharts
ISO Sensitivity and Exposure Index
Introduction - Modules - Equations - RAW files - Related documents
Shannon information capacity - information that can pass through a channel without error
Meaning - Results - Summary
Blur units, MTF, and DXO Analyzer's BxU
The Imatest Test Lab - How to build a testing lab
Introduction - Hardware - Lighting - Easel - Light measurement - Tripod - Clamps - Putting it together - Targets - Aligning target & camera
Imatest Instructions -- General
Installation - and getting started
Install - Purchase - Register - Offline registration - Files
Using Imatest
Running Imatest - multi_read - RAW files - Other controls - Pulldown menus - Figures - .CSV and XML output - Use of Imatest
RAW files
Introduction - Using RAW files - Bayer RAW - dcraw demosaicing - Rawview utility - Generalized Read Raw
The Imatest Test Lab - How to build a testing lab
Introduction - Hardware - Lighting - Easel - Light measurement - Tripod - Clamps - Putting it together - Targets - Aligning target & camera
Troubleshooting - What to do when Imatest doesn't work
Installation problems - Problems after install - Missing DLLs - Runtime problems - INI files - Command (DOS) window - Diagnostics runs - Path conflicts
Imatest Instructions -- Sharpness modules
Using SFR Part 1 - Setting up and photographing SFR targets
Slanted-edge test - Print chart - Lighting - Distance - Exposure - Tips - Quality and Distance
Using SFR Part 2 - Running Imatest SFR
Image file - ROI - Additional input - Equations - Gamma - Warnings - Saving - Repeated runs - Excel CSV output
Imatest SFR LCD target
Screen Patterns module - Web pattern
SFR results: MTF (Sharpness) plot
SFR results: - Chromatic Aberration, Noise, and Shannon capacity plot
SFR results: Multiple ROI (Region of Interest) plot
2D Summary plot - 1D Summary plot - CSV Output file - Summary explanation - Excel plots
Using SFRplus Part 1 - The SFRplus chart: features and how to photograph it
Slanted-edge test - Advantages - Obtain chart - Print chart - Lighting - Distance - Exposure - Tips - Quality and Distance
Using SFRplus Part 2 - Running Imatest SFRplus
Running SFRplus - Rescharts - SFRplus settings windows - Parameters & setup window - Settings & options window - Gamma - Warnings - SFRplus
summary
Imatest Documentation
2 of 451

Using SFRplus Part 3 - Imatest SFRplus results
SFRplus results - Saving - Repeated runs - Excel .CSV (Comma Separated Values) output
Using Rescharts - Analysis of resolution-related charts
Introduction - Getting started - The Rescharts window - Rescharts modules - Slanted-edge SFR - Log frequency (simple) - Log frequency-contrast
Log Frequency - Analysis of log frequency-varying charts
Introduction - Photographing, running - Color moire - Output - Pattern - MTF - Comparisons - Calculation details - Nyquist, aliasing
Log F-Contrast - Analysis of charts that vary in log frequency and contrast
Introduction - Creating, printing - Photographing, running - Output - Pattern - MTF - MTF/contrast contours - MTFnn
Star Chart - Analysis of the Siemens star chart
Introduction - Creating, photographing, running - Output - MTF - MTFnn, MTFnnP - MTF contours - Equations
MTF Compare - Compare MTFs of different cameras and lenses
Introduction - Instructions
Batchview - Postprocessor for viewing summaries of SFR, SFRplus results
Introduction - Preparation - Instructions
How to Test Lenses with SFRplus
Introduction - Test chart - Photograph - Run SFRplus - Rescharts SFRplus - SFRplus settings - Interpret the results - Batches - Checklist
How to Test Lenses with SFR - (old page: Imatest SFRplus recommended)
Introduction - Test target - Photograph - Run SFR - Interpret - Checklist
Imatest Instructions -- Tone, color, and spatial modules
Using Stepchart
Photographing the chart - Running Stepchart - Output - Saving - Dynamic range - Algorithm
Stepchart: Applied Image and ISO charts
Photographing chart - Instructions - Patch order
Dynamic Range - Calculate Dynamic Range from several Stepchart images
Introduction - Operation - Results - Dynamic Range bkgnd
Using Colorcheck
What Colorcheck does - Colorchecker colors - Photographing target - Photographing target - Colorchecker reference sources - Output - Saving - Links
Colorcheck Appendix - Algorithms and reference formulas
Color error formulas - Algorithm - Grayscale and exposure
Using Multicharts - Interactive analysis of several test charts
Introduction - Getting started - Reference files - The Multicharts window - Displays and options
Multicharts Special Charts - Additional charts, including circles arranged on a square
Instructions - Patch numbering - Examples
Color correction matrix
Introduction - Math - Multicharts
Using Uniformity (Light Falloff) - Measures light falloff (lens vignetting) and sensor nonuniformity
Instructions - Results
Uniformity (Light Falloff): Imatest Master - Instructions for Imatest Master
Input dialog box - Hot and dead pixels - Color shading - Uniformity profiles - Polynomial fit - Histograms - Noise detail - Spot detection
Using Distortion
Introduction - Instructions - Results - Main figure - Decentering - Corrected image - Intersection figure - Radius correction fig - Links - Algorithm
Imatest Instructions -- Miscellaneous modules and utilities
Using Test Charts - Creates test charts for high quality inkjet printers
Introduction - Bitmap patterns - SVG patterns - Options
Using Screen Patterns - Monitor patterns for Light Falloff, SFR, Distortion, and monitor calibration
Introduction - Light Falloff - SFR - Distortion - Monitor calibration - Monitor gamma - Zone plate - SMPTE color bars - Slanted edges - Colorchecker-
Stepchart - Squares (checkerboard)
SVG Test Charts - Scalable Vector Graphics charts for MTF measurements
Introduction: m x n squares - Squares and wedges - Operation - Options - Output figure - Printing
View/Rename Files - using EXIF data
Starting - 1. Select folder - 2. Select files - 3. Rename options - 4. Preview - 5. Rename files
Imatest IT/EXE instructions - Running Imatest IT (Industrial Testing)/EXE
Introduction - Installation - Setup - INI files - DOS call - Calling from Matlab - Testing - Error handling
Using Print Test - Measure print quality factors: color response, tonal response, and Dmax
Introduction - Instructions - Results
Maskfill - Removes features that interfere with Imatest measurements
Imatest Documentation
3 of 451

Introduction - Instructions
Appendix
Cross-reference tables - Tables to help you navigate Imatest
Suppliers - Image quality factors - Image quality factors - Modules - Test charts - Test images
Version comparisons - Differences between versions. Which is right for you?
Glossary
Glosario en Espanol
Troubleshooting - What to do when Imatest doesn't work
Installation problems - Problems after install - Missing DLLs - Runtime problems - INI files - Command (DOS) window - Diagnostics runs - Path conflicts
Imatest Change Log - Imatest release history
XML Changes - New XML improvements in Imatest 3.5.1+
Complete PDF documentation - The whole docs 14 MB and almost 500 pages, updated occasionally
License - The Imatest End User License Agreement (EULA)
Imatest Documentation
4 of 451
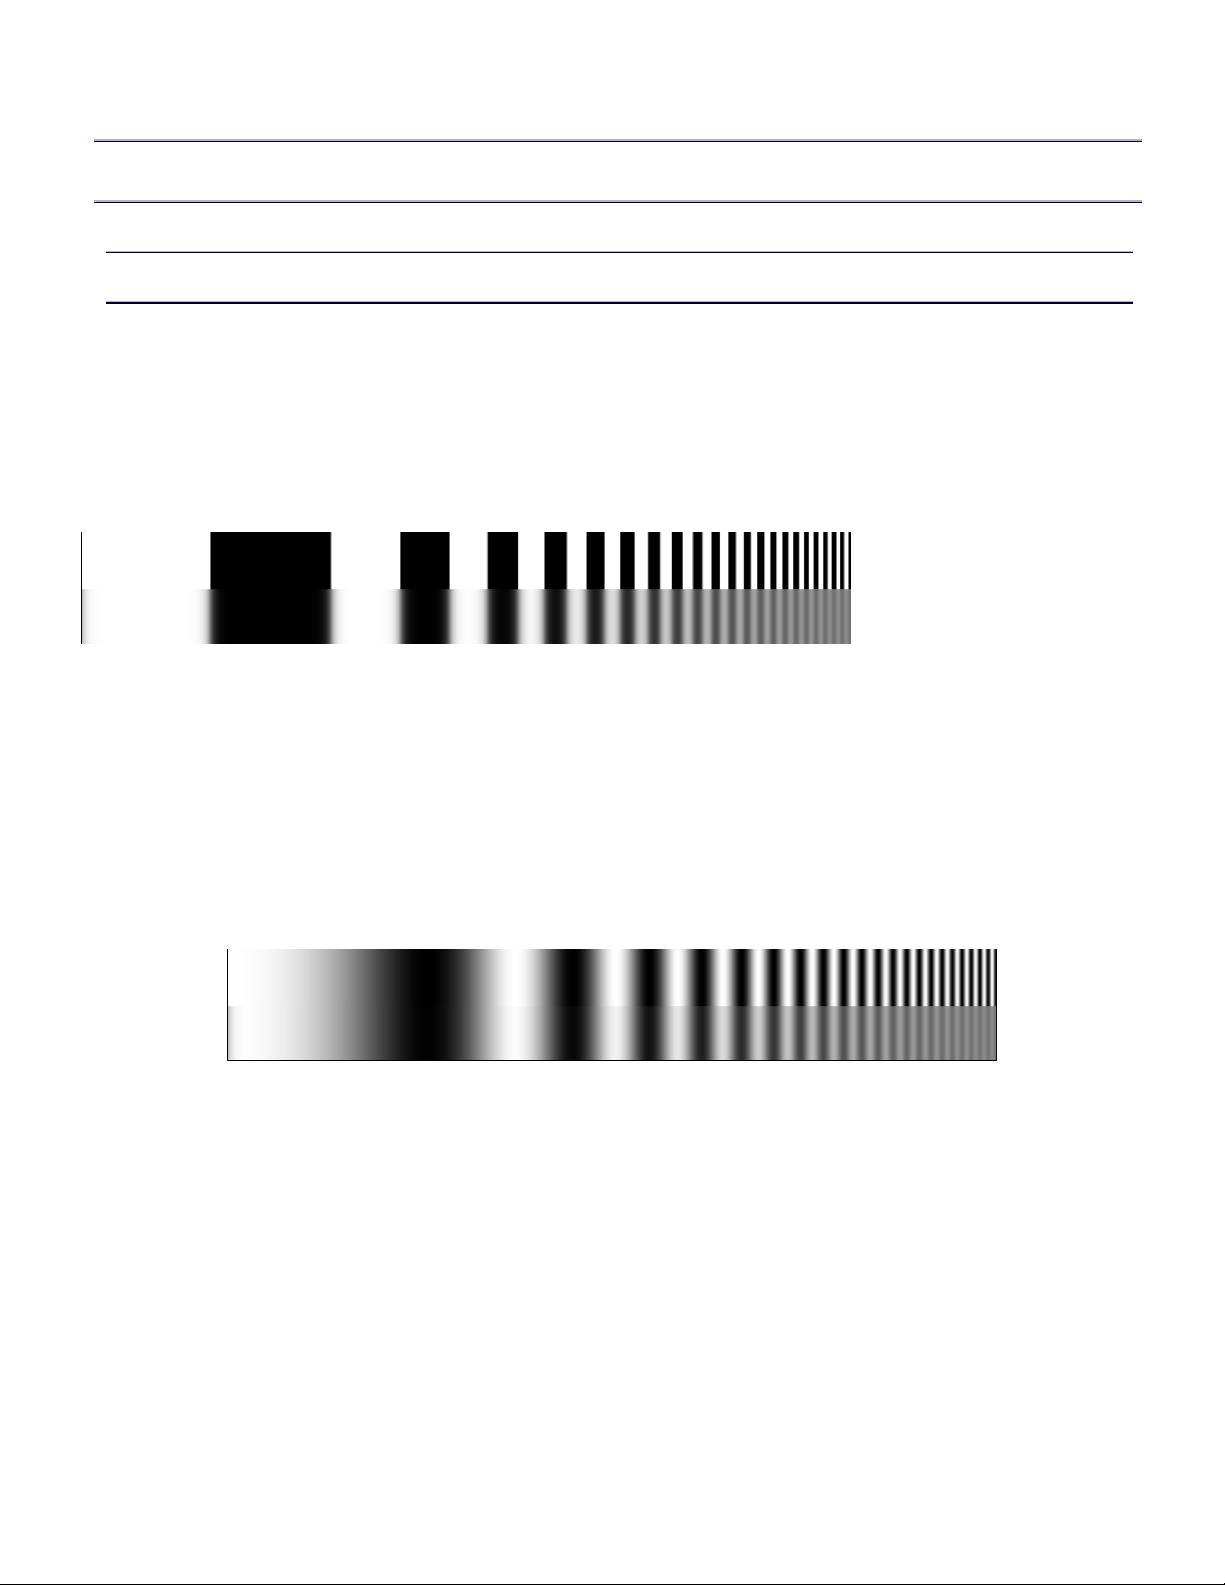
Image Quality
Sharpness
What is it and how is it measured?
Image sharpness
Sharpness is arguably the most important photographic image quality factor: it's the factor most closely related to the amount of
detail an image can render. But it's not the only important factor. Imatest measures a great many others.
Sharpness is defined by the boundaries between zones of different tones or colors. It is illustrated by the bar pattern of increasing
spatial frequency, below. The top portion represents a target used to test a camera/lens combination. It is sharp; its boundaries are
abrupt, not gradual. The bottom portion illustrates the effect of a high quality 35mm lens on a 0.5 millimeter long image of the
pattern (on the film or digital sensor plane). It is blurred. All lenses, even the finest, blur images to some degree. Poor lenses blur
images more than fine ones.
One way to measure sharpness is to use the rise distance of the edge, for example, the distance (in pixels, millimeters, or fraction
of image height) for the pixel level to go from 10% to 90% of its final value. This is called the 10-90% rise distance. Although rise
distance is a good indicator of image sharpness, it has one limitation. It is poorly suited for calculating the sharpness of a complete
imaging system from the sharpness of its components, for example, from a lens, digital sensor, and software sharpening algorithm.
To get around this problem, measurements are made in frequency domain, where frequency is measured in cycles or line
pairs per distance (typically millimeters in film measurements, but may also be inches, pixels, or image height). Line pairs per
millimeter (lp/mm) is the most common spatial frequency unit for film, but cycles/pixel is convenient for digital sensors. The
image below is a sine wave— a pattern of pure tones— that varies from low to high spatial frequencies, in this case from 2 to 200
lp/mm, over a distance of 0.5 millimeters. The top portion is the original sine pattern. The bottom portion illustrates the effects of
the same high quality 35mm lens, which reduces pattern contrast at high spatial frequencies.
The relative contrast at a given spatial frequency (output contrast/input contrast) is called the Modulation Transfer Function
(MTF) or Spatial Frequency Response (SFR).
Illustration of Modulation Transfer Function (MTF)
(Spatial frequency response (SFR) )
Imatest Documentation
5 of 451


