没有合适的资源?快使用搜索试试~ 我知道了~
资源详情
资源评论
资源推荐
google perftools 分析程序性能
Google perftools
1、功能简介
它的主要功能就是通过采样的方式,给程序中 cpu 的使用情况进行“画像”,通过它所输出
的结果,我们可以对程序中各个函数(得到函数之间的调用关系)耗时情况一目了然。在
对程序做性能优化的时候,这个是很重要的,先把最耗时的若干个操作优化好,程序的整
体性能提升应该十分明显,这也是做性能优化的一个最为基本的原则—先优化最耗时的。
2、安装
1、下载 gperftools
Wgethttps://code.google.com/p/gperftools/downloads/detail?
name=gperftools-2.0.tar.gz
2、tar –xzf gperftools-2.0.tar.gz
3、cd gperftools-2.0
4、./con$gure --pre$x=/usr/local –enable-frame-pointers
5、make && make install
ps:编译时打开了 –enable-frame-pointers ,这要求被测试的程序在编译时要加上 gcc
编译选项,否则某些多线程程序可能会 core:
CCFLAGS=-fno-omit-frame-pointer
ps:perftools 对 2.4 内核的多线程支持不是很好,只能分析主线程,但是 2.6 内核解决
了这个问题。
安装图形化分析工具 kcachegrind:
kcachegrind 用来分析产生的 pro$ling 文件,linux 环境下使用。
kcachegrind install:sudoapt-getinstallkcachegrind
3、使用
方法有三种:
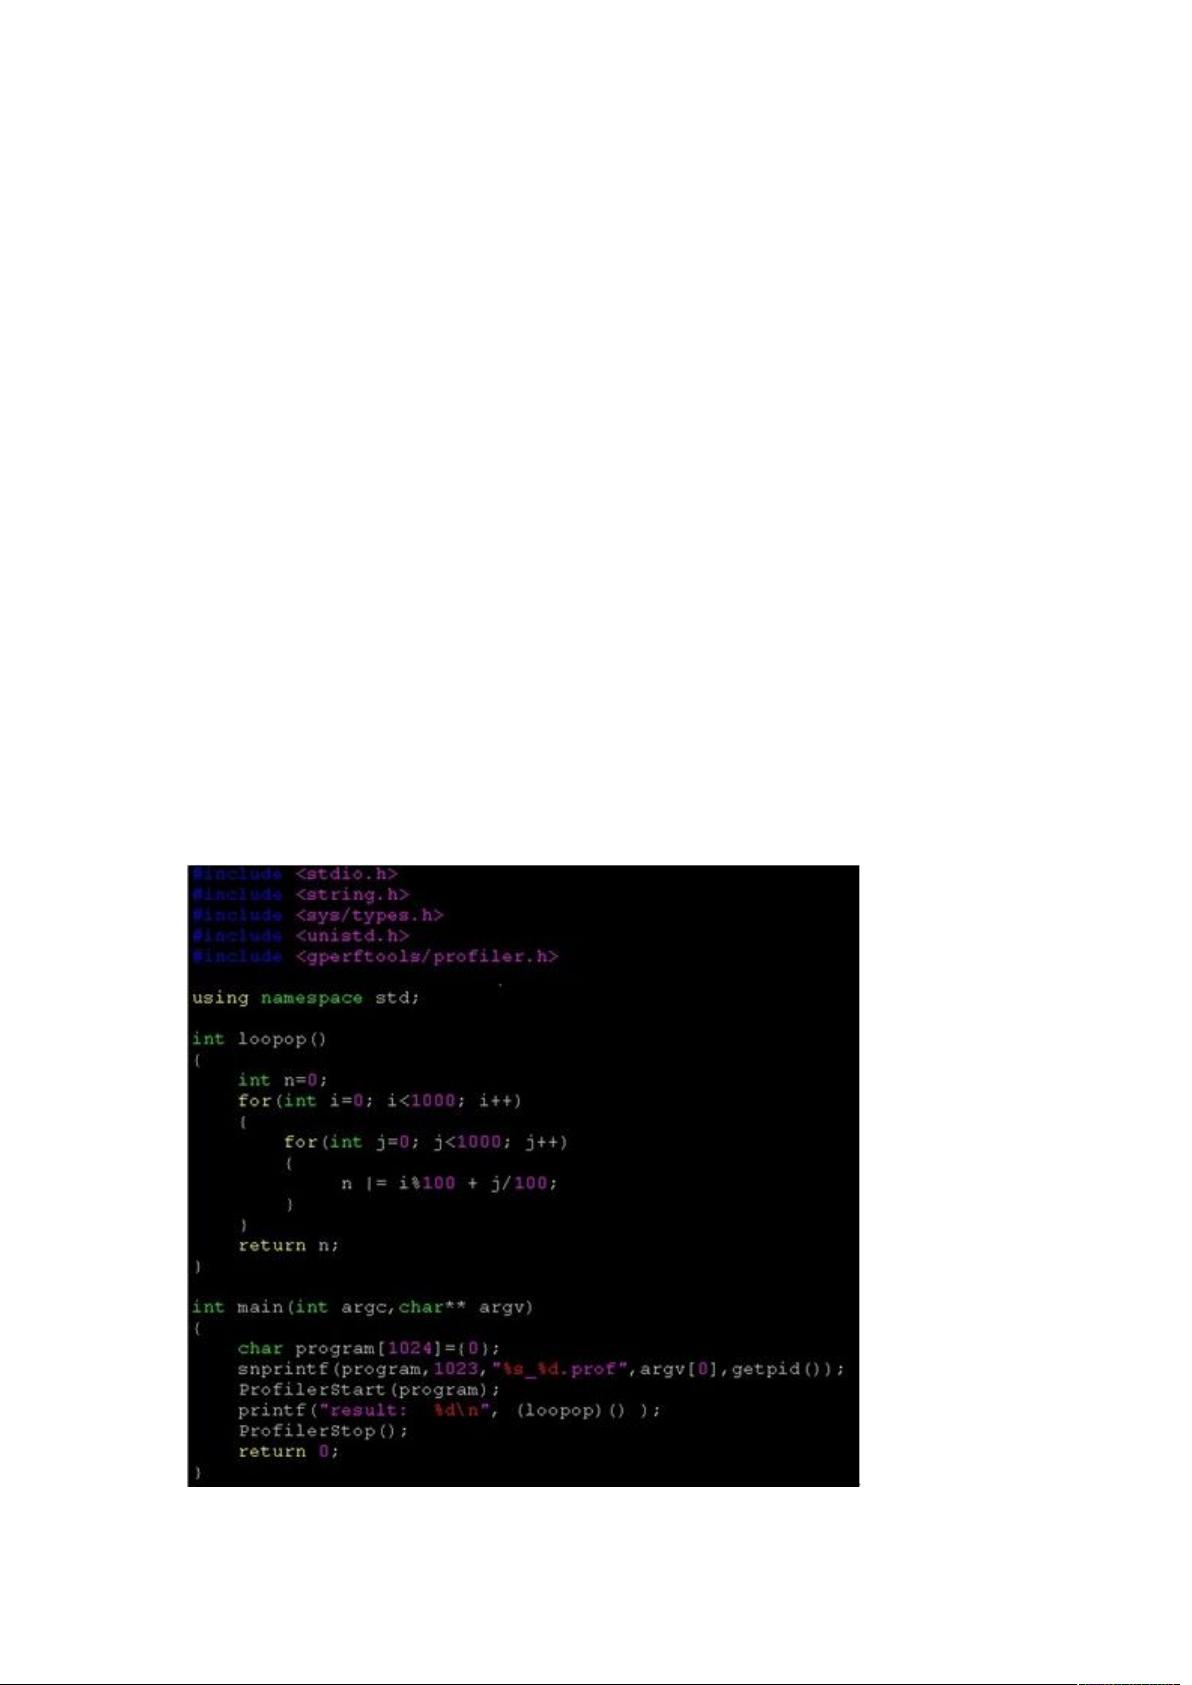
1、直接调用提供的 api:这种方式比较适用于对于程序的某个局部来做分析的情况,直接
在要做分析的局部调用相关的 api 即可。
方式:调用函数:Pro$lerStart()andPro$lerStop()
2、链接静态库:这种方式是最为常用的方式,后面会有详细的介绍。
方式:在代码 link 过程中添加参数 –lpro$ler
For example:gcc […] -o helloworld –lpro$ler
运行程序:env CPUPROFILE=./helloworld.prof ./helloworld
指定要 pro$le 的程序为 helloworld,并且指定产生的分析结果文件的路径为./
helloworld.prof
3、链接动态库:这种方式和静态库的方式差不多,但通常不推荐使用,除非使用者不想
额外链一个静态库(因为链接静态库会增大 binary 的大小)的情况,可以考虑使用这种
方式。
方式:运行时使用 LD_PRELOAD,e.g.% env
LD_PRELOAD="/usr/lib/libpro$ler.so" <binary>(不推荐这种方式)。
Ps:env 是 linux 下插入环境变量的 shell 命令
4、 查看收集数据结果
查看 pro$le 结果:pprof 工具,它是一个 perl 的脚本,通过这个工具,可以将 google-
perftool 的输出结果分析得更为直观,输出为图片、pdf 等格式。
Ps:在使用 pprof 之前需要先安装运行 per15,如果要进行图标输出则需要安装 dot,如
果需要--gv 模式的输出则需要安装 gv。
调用 pprof 分析数据文件:
% pprof /bin/ls ls.prof
Enters "interactive" mode
% pprof --text /bin/ls ls.prof
Outputs one line per procedure
% pprof --gv /bin/ls ls.prof
Displays annotated call-graph via 'gv'
% pprof --gv --focus=Mutex /bin/ls ls.prof
Restricts to code paths including a .*Mutex.* entry
% pprof --gv --focus=Mutex --ignore=string /bin/ls ls.prof
Code paths including Mutex but not string
% pprof --list=getdir /bin/ls ls.prof
(Per-line) annotated source listing for getdir()
% pprof --disasm=getdir /bin/ls ls.prof
(Per-PC) annotated disassembly for getdir()
% pprof --text localhost:1234
Outputs one line per procedure for localhost:1234
% pprof --callgrind /bin/ls ls.prof
Outputs the call information in callgrind format
分析 callgrind 的输出:
使用 kcachegrind 工具来对.callgrind 输出进行分析
e.g.% pprof --callgrind /bin/ls ls.prof > ls.callgrind
% kcachegrind ls.callgrind
4、举例
事例一:cpu_pro$ler_example.cpp,在代码中插入标签,可以针对某个函数进行特定
的 pro$le
代码如下:
剩余10页未读,继续阅读
震天震地震自己
- 粉丝: 2
- 资源: 12
上传资源 快速赚钱
- 我的内容管理 展开
- 我的资源 快来上传第一个资源
- 我的收益 登录查看自己的收益
- 我的积分 登录查看自己的积分
- 我的C币 登录后查看C币余额
- 我的收藏
- 我的下载
- 下载帮助
安全验证
文档复制为VIP权益,开通VIP直接复制
信息提交成功
评论0