[Wiki](https://gitee.com/smartchart/smartchart/wikis/pages) \|
[Community](https://www.smartchart.cn/) \|
[Sponsors](https://www.smartchart.cn/) \|
[GitHub](https://github.com/JohnYan2017/Echarts-Django) \|
[Gitee](https://gitee.com/smartchart/smartchart)
<p align="center">
<a href="https://www.smartchart.cn"><img src="http://smartchart.cn/static/smartui/img/smartlogo.png" width="45%"></a>
</p>
<p align="center">
<strong>A platform that Connect Data to Echarts.</strong>
</p>
<p align="center">
<a href="https://www.smartchart.cn">https://www.smartchart.cn</a>
</p>
<p align="center">
<img src="https://img.shields.io/badge/Release-V5.4-green.svg" alt="Downloads">
<a target="_blank" href="https://www.python.org/downloads/release/python-390/">
<img src="https://img.shields.io/badge/Python-3.6+-green.svg" />
</a>
<a href='https://gitee.com/smartchart/smartchart/members'><img src='https://gitee.com/smartchart/smartchart/badge/fork.svg?theme=dark' alt='fork'></a>
<a href='https://gitee.com/smartchart/smartchart/stargazers'><img src='https://gitee.com/smartchart/smartchart/badge/star.svg?theme=dark' alt='star'></a>
<a target="_blank" href='https://github.com/JohnYan2017/Echarts-Django'>
<img src="https://img.shields.io/github/stars/JohnYan2017/Echarts-Django.svg?style=social" alt="github star"/>
</a>
</p>
<p align="center">
<a href="https://qm.qq.com/cgi-bin/qm/qr?k=eC34KwVvEtMvfh8Zyn1RSfYlzZvuvm7i&jump_from=webapi"><img src="https://img.shields.io/badge/QQ群-476715246-orange"/></a>
<a target="_blank" href="https://www.smartchart.cn">
<img src="https://img.shields.io/badge/Author-John%20Yan-ff69b4.svg" alt="Downloads">
</a>
<a target="_blank" href="https://www.smartchart.cn">
<img src="https://img.shields.io/badge/Copyright%20-@smartchart.cn-%23ff3f59.svg" alt="Downloads">
</a>
</p>
-------------------------------------------------------------------------------
[**English Documentation**](README-EN.md)
-------------------------------------------------------------------------------
### 简介
- Smartchart是数据可视化,大屏,移动报表,WEB应用的微代码开发平台
- 简单, 敏捷, 高效, 通用化, 高度可定制化, 让你的项目瞬间档次提升
- 完全真正打通前后端, 支持图形数据联动,筛选,钻取, 支持几乎常见的所有数据库
- 积木式拖拽开发模式, 开箱即用, 安装简单, 依赖少, 适应各种平台
- 支持Django App插件方式应用, 支持数据分析Jupyter方式应用
- 内存加速技术, 让你的数据快人一步, 大幅减少数据库压力
- 所见即所得的拖拽开发模式, 无需在画布上设计
- 支持websocket, 数据填报设计,前端埋点
- 支持仪表盘备份恢复快照等, 满足企业级的版本控制开发上线流程要求
- 没有重复学习成本, 高度可定制化, 注意是高度可定制化!!

### 样列
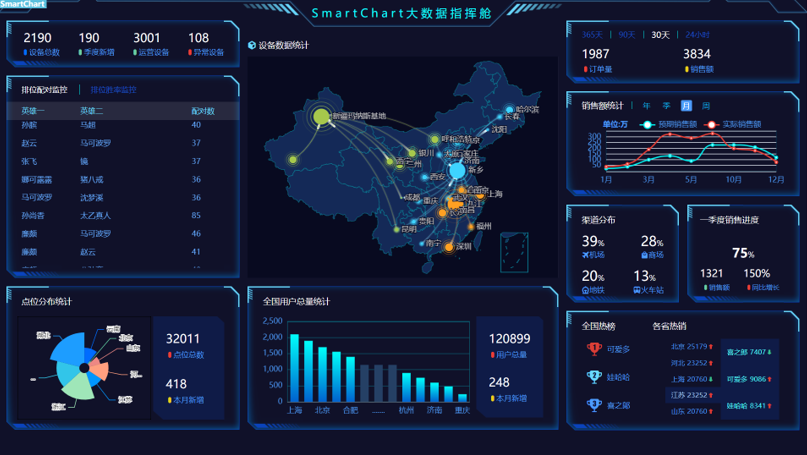
- [SmartChart大屏样列-智慧城市_大数据大屏](https://magiccube.smartchart.cn/echart/?type=5 "大屏样列-智慧城市_大数据大屏")
- [SmartChart集成DataV](https://magiccube.smartchart.cn/echart/?type=3 "集成DATAV")
- [Smartchart图形数据联动](https://magiccube.smartchart.cn/echart/?type=4 "图形数据联动")
### 快速开始
#### 安装Python环境
- 环境准备: 官方[最新Python下载链接](https://www.python.org/downloads/release/python-390/ "最新Python下载链接")
如果下载太慢, 可以到[淘宝镜象下载](https://npm.taobao.org/mirrors/python/3.9.0/ "淘宝镜象下载")
也可以直接下载[WINDOWS64位安装版](https://npm.taobao.org/mirrors/python/3.9.0/python-3.9.0-amd64.exe "WINDOWS64位安装版")
[MAC电脑安装版](http://npm.taobao.org/mirrors/python/3.9.0/python-3.9.0rc2-macosx10.9.pkg "MAC电脑安装版")
- [Window平台安装视屏介绍](https://www.ixigua.com/6910413586208653837?id=6901867671193649668 "Window平台安装视屏介绍")
**注意: Windows安装Python时需选中"Add to Path"**
#### 安装SmartChart
```shell script
pip3 install smartchart
如果安装过程慢,建意使用
pip3 install -i https://pypi.tuna.tsinghua.edu.cn/simple smartchart -U
升级方法:
pip3 install smartchart -U (升级)
```
[SmartChart入门文档入口](https://gitee.com/smartchart/smartchart/wikis/ "SmartChart入门")
### 应用场景一:
如果你仅需要一个数据可视化,大屏开发平台, 可以快速启动, 独立平台使用
```shell script
本地命令行启动:
smartchart
如果你是服务器部署,远程访问,服务端启动方式:
smartchart runserver 0.0.0.0:8000 --insecure --noreload
```
**管理员帐号密码: admin/admin, 请及时更改密码**
[SmartChart入门文档入口](https://gitee.com/smartchart/smartchart/wikis/ "SmartChart入门")
-------------------------------------------------------------------------------
### 应用场景二:
如果你是数据分析爱好者, 在使用jupyter, Pandas等分析工具, 你可以当做可视化工具使用
**支持像pyecharts,Matplotlib等python绘图工具一样在Jupyter中使用, 更加方便, 更加炫酷**
**仅仅只有两个命令,get and set, 简化数据分析工作, 还能固化分析好的数据, 生成炫酷的仪表盘**
[Jupyter中使用SmartChart入门文档](https://gitee.com/smartchart/smartchart/wikis/6.Jupyter%E5%BA%94%E7%94%A8/%E5%9C%A8Jupyter%E4%B8%AD%E4%BD%BF%E7%94%A8%E6%8C%87%E5%BC%95 "Jupyter中使用SmartChart入门文档")
-------------------------------------------------------------------------------
### 应用场景三:
你也可以使用smartchart制做报表, 在你的应用系统中嵌入报表
[嵌入SmartChart报表入门文档](https://gitee.com/smartchart/smartchart/wikis/7.%E6%8A%A5%E8%A1%A8%E5%B5%8C%E5%85%A5/%E7%AE%80%E5%8D%95%E5%B5%8C%E5%85%A5 "嵌入SmartChart报表入门文档")
-------------------------------------------------------------------------------
### 应用场景四:
如果你是django应用的开发者, 那么恭喜你, 它能无缝的作为你项目的一部分
数据可视化, 仪表盘, 低代码API开发平台的功能瞬间拥有
[在Django中应用Smartchart入门文档](https://gitee.com/smartchart/smartchart/wikis/8.Django%E5%BA%94%E7%94%A8/%E5%B5%8C%E5%85%A5Django%20Apps "在Django中应用Smartchart")
- django新手推荐下载此项目使用
```shell script
请直接下载gitee/github的项目后
pip install smartchart
启动方式 python manage.py runserver
帐号: admin/admin
```
### 应用场景五:
smartchart不仅仅是一个可视化平台, 也是一个低代码服务API开发平台, 如果你需要对外提供
API服务, smartchart可以让你轻松完成
[Smartchart低代码API开发](https://gitee.com/smartchart/smartchart/wikis/9.%E8%BF%9B%E9%98%B6%E5%BC%80%E5%8F%91PRO/%E6%95%B0%E6%8D%AE%E6%9C%8D%E5%8A%A1API "Smartchart低代码API开发")
------------------------------------------------
### 数据库支持说明
Smartchart理论上可以支持任意的数据源, 详见文档中使用说明
### 联系我们与帮助
你也可以加入QQ群进行普通问题讨论
**QQ群: 476715246 暗号: smartchart**
-------------------------------------------------------------------------------
#### Change Log
```shell script
2020/12/14 静态资源本地化
v3.9.8.2 支持所有常见数据库,支持VUE,DATAV
v3.9.8.7 支持Jupyter,支持一键分享和应用dashboard模板
v3.9.8.9 帐号绑定功能上线
v3.9.8.10 用户自定义图形管理上线
v3.9.8.17 支持最新的Echarts5.0, 优化加载速度
v3.9.8.20 用户自定义图形管理功能升级
v3.9.8.23 Echarts升级5.0.1, 支持一个数据集对应多查询, 资源本地化
v3.9.9.0 print函数优化,新增数据透视函数,个人静态资源路径显示, db2支持
v3.9.9.1 开发界面美化
v3.9.9.5 开�
完整前后端数据可视化系统.zip

版权申诉
 完整前后端数据可视化系统.zip (29个子文件)
  smartchart-master log
  .keep 0B deploy smartchart.service 262B nginx.conf 1KB uwsgi.ini 472B uwsgi_params 662B README-EN.md 11KB templates diy
  common.html 385B LICENCE 11KB static custom css common0.css 7KB images
  map.png 302KB head_bg.png 8KB jt.png 72KB lbx.png 81KB
 bg.jpg 252KB line.png 4KB
 loading.gif 701B js index.html 9KB font DS-DIGIT.TTF 25KB db.sqlite3 572KB .idea .gitignore 176B smartcharts wsgi.py 399B __init__.py 0B settings.py 4KB asgi.py 399B urls.py 996B
 requirements.txt 10B manage.py 1KB .gitignore 49B README.md 11KB
资源评论

 lumengzhao12022-06-27用户下载后在一定时间内未进行评价,系统默认好评。
- kefuyinuo12022-09-28资源很受用,资源主总结的很全面,内容与描述一致,解决了我当下的问题。
- djw18882022-07-16非常有用的资源,有一定的参考价值,受益匪浅,值得下载。
- 金陈林2022-07-15终于找到了超赞的宝藏资源,果断冲冲冲,支持!
- 2301_765214662023-06-01资源内容详实,描述详尽,解决了我的问题,受益匪浅,学到了。


