


See discussions, stats, and author profiles for this publication at: https://www.researchgate.net/publication/345453759
Argo Data 1999–2019: Two Million Temperature-Salinity Profiles and
Subsurface Velocity Observations From a Global Array of Profiling Floats
ArticleinFrontiers in Marine Science · September 2020
DOI: 10.3389/fmars.2020.00700
CITATIONS
14
READS
594
101 authors, including:
Some of the authors of this publication are also working on these related projects:
Argo Data Management View project
Suivi topomorphologique du cordon dunaire du Vougot (commune de Guissény) View project
Annie P. S. Wong
University of Washington Seattle
21 PUBLICATIONS1,182 CITATIONS
SEE PROFILE
Susan Wijffels
The Commonwealth Scientific and Industrial Research Organisation
56 PUBLICATIONS3,921 CITATIONS
SEE PROFILE
Stephen Riser
University of Washington Seattle
128 PUBLICATIONS5,181 CITATIONS
SEE PROFILE
Sylvie Pouliquen
Institut Français de Recherche pour l'Exploitation de la Mer
73 PUBLICATIONS1,514 CITATIONS
SEE PROFILE
All content following this page was uploaded by Speich Sabrina on 29 November 2020.
The user has requested enhancement of the downloaded file.
SYSTEMATIC REVIEW
published: 15 September 2020
doi: 10.3389/fmars.2020.00700
Frontiers in Marine Science | www.frontiersin.org 1 September 2020 | Volume 7 | Article 700
Edited by:
Johannes Karstensen,
GEOMAR Helmholtz Center for Ocean
Research Kiel, Germany
Reviewed by:
Borja Aguiar-González,
University of Las Palmas de Gran
Canaria, Spain
Fabien Roquet,
University of Gothenburg, Sweden
*Correspondence:
Annie P. S. Wong
apsw.uw@gmail.com
Specialty section:
This article was submitted to
Ocean Observation,
a section of the journal
Frontiers in Marine Science
Received: 01 June 2020
Accepted: 31 July 2020
Published: 15 September 2020
Argo Data 1999–2019: Two Million
Temperature-Salinity Profiles and
Subsurface Velocity Observations
From a Global Array of Profiling
Floats
Annie P. S. Wong
1
*
, Susan E. Wijffels
2
, Stephen C. Riser
1
, Sylvie Pouliquen
3
,
Shigeki Hosoda
4
, Dean Roemmich
5
, John Gilson
5
, Gregory C. Johnson
6
, Kim Martini
7
,
David J. Murphy
7
, Megan Scanderbeg
5
, T. V. S. Udaya Bhaskar
8
, Justin J. H. Buck
9
,
Frederic Merceur
3
, Thierry Carval
3
, Guillaume Maze
10
, Cécile Cabanes
10
, Xavier André
11
,
Noé Poffa
3
, Igor Yashayaev
12
, Paul M. Barker
13
, Stéphanie Guinehut
14
,
Mathieu Belbéoch
15
, Mark Ignaszewski
16
, Molly O’Neil Baringer
17
, Claudia Schmid
17
,
John M. Lyman
6,18
, Kristene E. McTaggart
6
, Sarah G. Purkey
5
, Nathalie Zilberman
5
,
Matthew B. Alkire
1
, Dana Swift
1
, W. Brechner Owens
2
, Steven R. Jayne
2
, Cora Hersh
2
,
Pelle Robbins
2
, Deb West-Mack
2
, Frank Bahr
2
, Sachiko Yoshida
2
, Philip J. H. Sutton
19
,
Romain Cancouët
20
, Christine Coatanoan
3
, Delphine Dobbler
3
, Andrea Garcia Juan
20
,
Jerôme Gourrion
21
, Nicolas Kolodziejczyk
10
, Vincent Bernard
3
, Bernard Bourlès
22
,
Hervé Claustre
23
, Fabrizio D’Ortenzio
23
, Serge Le Reste
11
, Pierre-Yve Le Traon
24
,
Jean-Philippe Rannou
25
, Carole Saout-Grit
26
, Sabrina Speich
27
, Virginie Thierry
10
,
Nathalie Verbrugge
14
, Ingrid M. Angel-Benavides
28
, Birgit Klein
28
, Giulio Notarstefano
29
,
Pierre-Marie Poulain
29
, Pedro Vélez-Belchí
30
, Toshio Suga
31
, Kentaro Ando
4
,
Naoto Iwasaska
32
, Taiyo Kobayashi
4
, Shuhei Masuda
4
, Eitarou Oka
33
, Kanako Sato
4
,
Tomoaki Nakamura
34
, Katsunari Sato
34
, Yasushi Takatsuki
34
, Takashi Yoshida
34
,
Rebecca Cowley
35
, Jenny L. Lovell
35
, Peter R. Oke
35
, Esmee M. van Wijk
35,36
,
Fiona Carse
37
, Matthew Donnelly
9
, W. John Gould
38
, Katie Gowers
9
, Brian A. King
38
,
Stephen G. Loch
9
, Mary Mowat
39
, Jon Turton
37
, E. Pattabhi Rama Rao
8
,
M. Ravichandran
40
, Howard J. Freeland
41
, Isabelle Gaboury
42
, Denis Gilbert
43
,
Blair J. W. Greenan
12
, Mathieu Ouellet
42
, Tetjana Ross
41
, Anh Tran
42
, Mingmei Dong
44
,
Zenghong Liu
45
, Jianping Xu
45
, KiRyong Kang
46
, HyeongJun Jo
46
, Sung-Dae Kim
47
and
Hyuk-Min Park
47
1
School of Oceanography, University of Washington, Seattle, WA, United States,
2
Woods Hole Oceanographic Institution,
Falmouth, MA, United States,
3
Ifremer, IRSI, Plouzané, France,
4
Japan Agency for Marine-Earth Science and Technology,
Yokosuka, Japan,
5
Scripps Institution of Oceanography, La Jolla, CA, United States,
6
NOAA/Pacific Marine Environmental
Laboratory, Seattle, WA, United States,
7
Sea-Bird Scientific, Bellevue, WA, United States,
8
Indian National Centre for Ocean
Information Services, Ministry of Earth Sciences, Hyderabad, India,
9
British Oceanographic Data Centre, National
Oceanography Centre, Liverpool, United Kingdom,
10
University of Brest, Ifremer, CNRS, IRD, LOPS, Plouzané, France,
11
Ifremer, RDT-SIIM, Plouzané, France,
12
Bedford Institute of Oceanography, Fisheries and Oceans Canada, Dartmouth, NS,
Canada,
13
School of Mathematics and Statistics, University of New South Wales, Sydney, NSW, Australia,
14
Collecte
Localisation Satellites, Ramonville-Saint-Agne, France,
15
JCOMMOPS, Plouzané, France,
16
Fleet Numerical Meteorology
and Oceanography Center, Monterey, CA, United States,
17
NOAA/Atlantic Oceanographic and Meteorological Laboratory,
Miami, FL, United States,
18
JIMAR, University of Hawai’i at Manoa, Honolulu, HI, United States,
19
National Institute of Water
and Atmospheric Research (NIWA), Wellington, New Zealand,
20
Euro-Argo ERIC, Plouzané, France,
21
OceanScope,
Plouzané, France,
22
IRD, IMAGO, Technopole Pointe du Diable, Plouzané, France,
23
LOV, CNRS, Sorbonne Université,
Villefranche-sur-Mer, France,
24
Mercator-Océan International, Ramonville-Saint-Agne, France,
25
ALTRAN Ouest, Technopole
Brest Iroise, Site du Vernis, Brest, France,
26
Glazeo, Nantes, France,
27
LMD-IPSL, Département de Géosciences, ENS, PSL
Research University, Paris, France,
28
Bundesamt fuer Seeschifffahrt und Hydrographie, Hamburg, Germany,
29
National
Institute of Oceanography and Applied Geophysics, Sgonico, Italy,
30
Instituto Español de Oceanografia, Canary Islands,
Spain,
31
Department of Geophysics, Graduate School of Science, Tohoku University, Sendai, Japan,
32
Tokyo University of
Marine Science and Technology, Tokyo, Japan,
33
The University of Tokyo, Tokyo, Japan

Wong et al. Argo Data 1999–2019
34
Japan Meteorological Agency, Tokyo, Japan,
35
Oceans and Atmosphere, CSIRO, Hobart, TAS, Australia,
36
Australian
Antarctic Program Partnership, University of Tasmania, Hobart, TAS, Australia,
37
Met Office, Exeter, United Kingdom,
38
National Oceanography Centre, Southampton, United Kingdom,
39
British Geological Survey, Nottingham, United Kingdom,
40
National Centre for Polar and Ocean Research, Ministry of Earth Sciences, Goa, India,
41
Institute of Ocean Sciences,
Fisheries and Oceans Canada, Sidney, BC, Canada,
42
Marine Environmental Data Services, Fisheries and Oceans Canada,
Ottawa, ON, Canada,
43
Maurice Lamontagne Institute, Fisheries and Oceans Canada, Mont-Joli, QC, Canada,
44
National
Marine Data and Information Service, Tianjin, China,
45
State Key Laboratory of Satellite Ocean Environment Dynamics,
Second Institute of Oceanography, Ministry of Natural Resources, Hangzhou, China,
46
National Institute of Meteorological
Sciences, Seogwipo, South Korea,
47
Korea Institute of Ocean Science and Technology, Ansan, South Korea
In the past two decades, the Argo Program has collected, processed, and distributed
over two million vertical profiles of temperature and salinity from the upper two kilomete rs
of the global ocean. A similar number of subsurface velocity observations near 1,000
dbar have also been collected. This paper recounts the history of the global Argo
Program, from its aspiration ar ising out of the World Ocean Circulation Experiment, to the
development and implementation of its instrumentation and telecommunication systems,
and the various technica l problems encountered. We describe the Argo data system
and its quality control procedures, and the gradual changes in the vertical resolution
and spatial coverage of Argo data from 1999 to 2019. The accuracies of the float data
have been assessed by comparison with high-quality shipboard measurements, and are
concluded to be 0.002
◦
C for temperature, 2.4 dbar for pressure, and 0.01 PSS-78 for
salinity, after delayed-mode adjustments. Finally, the challenges faced by the vision of an
expanding Argo Program beyond 2020 are discussed.
Keywords: global, ocean, pressure, temperature, sa linity, Argo, profiling, floats
INTRODUCTION
Prior to the turn of the 21st century, comprehensive in-situ
ocean observations were difficult to obtain. Temperature and
salinity data were collected mainly from ships and moored
buoys, and were biased geographically toward the northern
hemisphere oceans, where most of these platforms operated.
Measurements acquired during ship-based surveys were mostly
along transect lines, thus leaving large spatial gaps in sampling.
Temporal coverage of data was also une v en, as sampling was
limited to the years and seasons when ships were available. Data
from the high latitudes during winter were especially sparse.
Large-scale measurements of upper ocean temperature were
made possible by the advent of the expendable bathythermograph
(XBT), but with no accompanying salinity measurements and
with relatively limited dat a coverage in the southern hemisphere.
These limitations in spati al and temporal oceanographic data
coverage, compounded by a lack of any systematic subsurface
salinity data, impaired the progress in operational oceanography
and ocean climate research.
In 1998, the Year of the Oc eans, an international team of
scientists proposed a design for a global array of autonomous
profiling floats to enhance the temperature and salinity
measurements of the upper ocean (
Argo Science Team, 1998).
This new network, called Argo, would be integrated into the
global ocean observing system, filling in the large data gaps
that existed in the in-situ ocean observations at that time. The
initial endorsements came from the CLIVAR Upper Ocean Panel
(UOP) and the Global Oce an Data Assimilation Experiment
(GODAE). The Argo Science Team (later renamed the Argo
Steering Team) was constituted at a joint meeting of the CLIVAR
UOP and GODAE in mid-1998. The Argo Program was further
endorsed as a pilot program by the Global Ocean Observing
System (GOOS).
The name Argo was chosen because of the program’s
complementary nature with Jason, the Centre National d’Études
Spatiales/National Aeronautics and Space Administration
(CNES/NASA) satellite oceanography sea level mission
(
Roemmich and Owens, 2000). In Greek mythology, Jason
sailed in a ship called Argo with his crew, the Argonauts.
In oceanography, Jason and Argo together would provide
regular global sea surface height and subsurface temperature
and salinity measurements, the variables that are necessary
for th e proper interpretation of sea surface height. Argo’s aim
was to provide sustained and glob al sampling of subsurface
temperature-salinity-pressure profiles and velocity fields by
using the autonomous profiling float technology. Today,
as an element of the GOOS, Argo has important synergies
with many of the other in-situ observation networks, which
include shipboard repeat hydrography, moored buoys, surface
drifters, XBT, glider transects, sea level stations, and animal-
borne profiling. The integration of the GOOS is coordinated
by the Observations Coordination Group (OCG), with the
Joint Technical Commission for Oceanography and Marine
Meteorology in-situ Observations Programme Support Centre
(JCOMMOPS) providing the technical support.
Conceptually, the design of the Argo array evolved from
the World Ocean Circulation Experiment (WOCE)’s shipboard
Frontiers in Marine Science | www.frontiersin.org 2 September 2020 | Volume 7 | Article 700

Wong et al. Argo Data 1999–2019
hydrographic program, deployment of Argo-type floats, and
its XBT network. The initial design of Argo called for the
deployment of over 3,000 profiling floats in a 3
◦
× 3
◦
array in
the ice-free open ocean between 60
◦
N and 60
◦
S (Argo Science
Team, 1998
). In a departure from the practices of that era,
the data from these floats would be freely disseminated in
real-time, allowing use in operational ocean and atmospheric
models. The data would be furt h er quality-controlled, and
this “delayed-mode” version would also be shared freely
with the scientific community. It was recognized that Argo
would require an international collaboration similar to that
developed by WOCE. The floats would be deployed by separate
groups from participating countries, but the data would be
shared internationally.
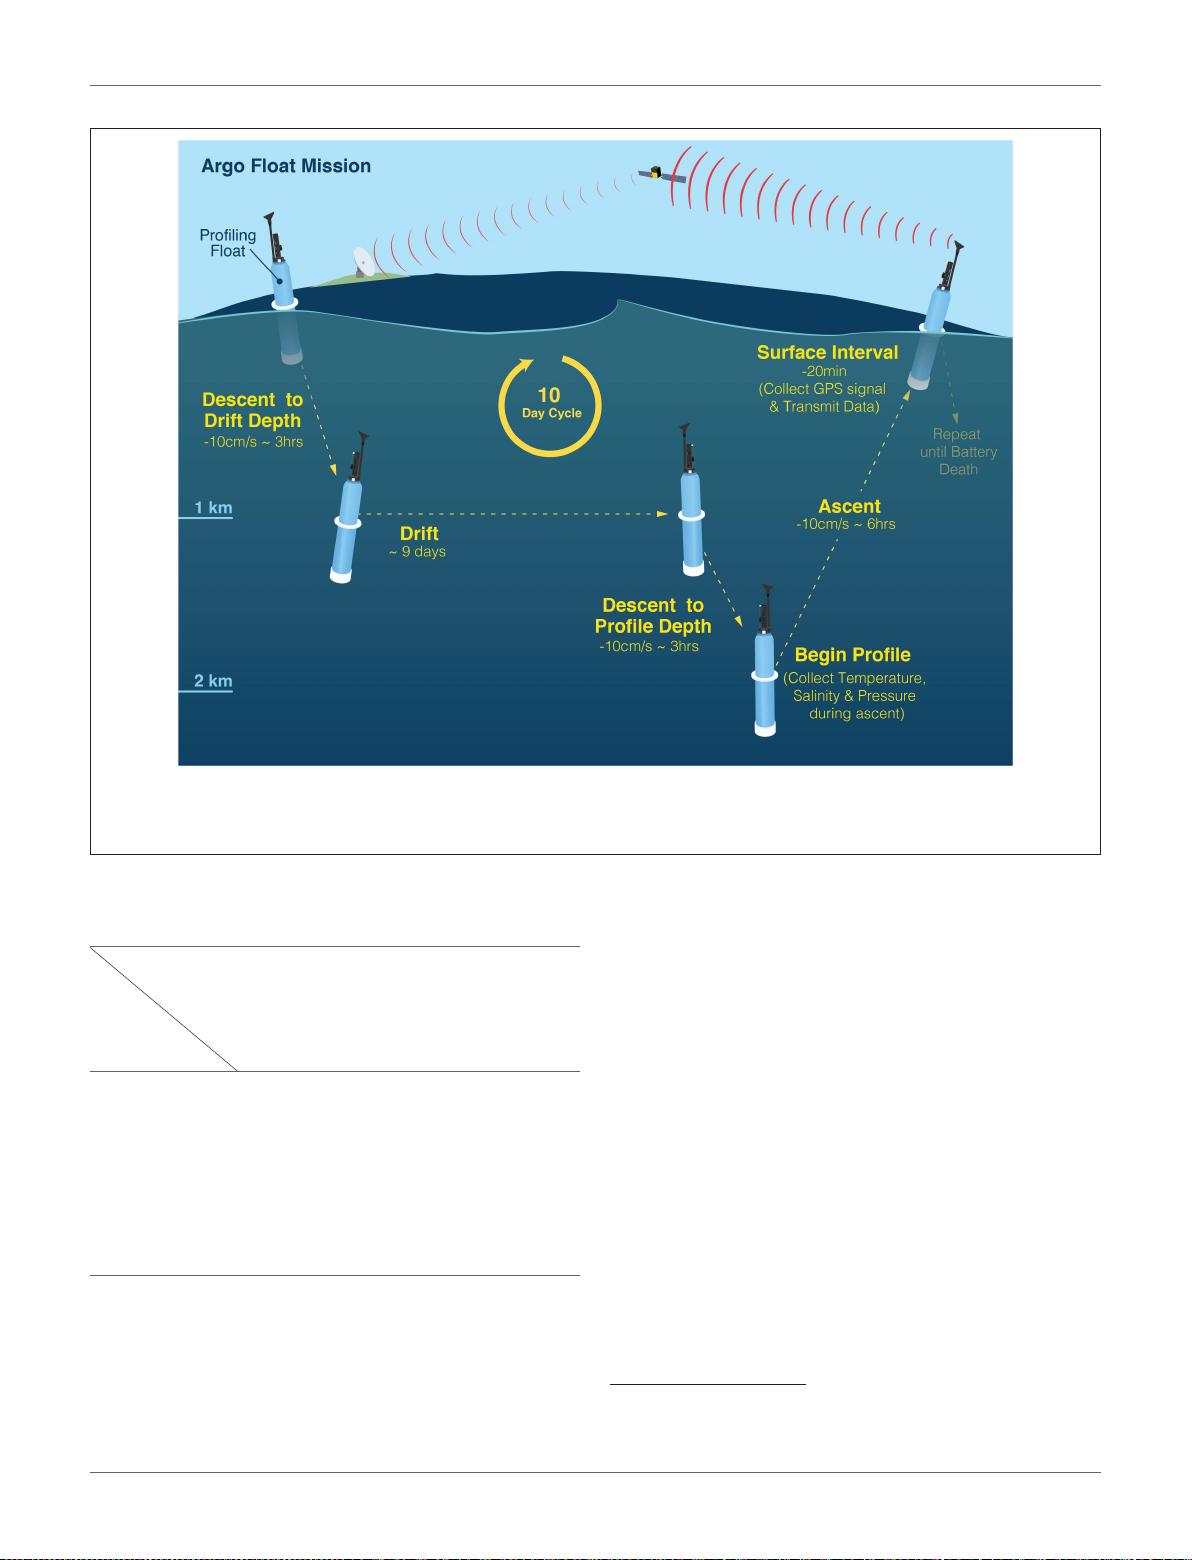
The standard Argo mission is known as “ park-and-profile”
(Figure 1). The floats park at a target pressure of 1,000 de ci bars
and drift with the ocean currents. Pressure in decibars (dbar; 1
dbar = 10,00 0 Pa) is approximately equal to depth in meters. The
Argo park level of 1,000 dbar was chosen to extend the absolute
velocity database collected during WOCE, which employed that
level based on its favorable signal-to-noise ratio. Every 10 days
the floats descend to 2,000 dbar and then collect a vertical
profile of temperature and salinity during ascent to the surface.
The positions of the floats at the sea surface are determined by
orbiting platforms, and the data are transmitted via satellite back
to shore. The floats then return to their target park pressure
and the cycle is repeated. Deployments of Argo floats began in
1999, and the 3,000-float goal was reached in November 2007.
Argo collected its one-millionth profile in October 2012 and its
two-millionth profile in September 2018.
This paper describes the pressure (P), temperature (T), salinity
(S), and subsurface velocity data from the Argo Program: the
instrumentation used, the technical problems encountered, th e
scientific quality of the data, the data distribution system, and
how the da taset has evolved in response to new technologies.
It has been over 20 years since t h e first deployment of Argo
floats in 1999. This has been a long journey for the scientists
who first conceived the Argo array, and yet it is but a short
step toward the goal of sustaining a comprehensive global ocean
obser vation system. This paper therefore serves the dual purpose
of documenting the characteristics and accuracy of the c ore Argo
dataset from its inception to 2019, as well as foretelling the
expansion of this global ocean dataset into 2020 and beyond.
INSTRUMENTATION USED IN ARGO
Platform History
The present-day autonomous profiling float was developed from
the neutrally buoyant float with short-range acoustic tracking
(
Swallow, 1955; Gould, 2005). During WOCE, Russ Davis and
Doug Webb in the United St a tes, and teams at L’Institut Français
de Recherche pour l’Exploitation de la Mer (Ifremer) in France,
equipped a new generation of floats with a pumping system and
satellite navigation, so they could cycle repeatedly to the sea
surface for satellite tracking in the ice-free ocean (
Davis et al.,
1992; Ollitrault et al., 1994a). The float density was changed
by pumping oil stored in an internal reservoir into an external
bladder to ascend, and by deflating the bladder to descend. In
WOCE, these early-model floats were used to determine the
absolute velocity field at the park level. MARVOR floats were
deployed in the eastern North Atlantic Ocean (
Speer et al., 1999)
and in the Brazil Basin of the South Atlantic Ocean (
Ollitrault
et al., 1994b). Autonomous Lagrangian Circulation Explorer
(ALACE) floats were deployed more widely (e.g., Davis, 1998). By
the end of the 1990s, the addition of conductivity-temperature-
depth
1
(CTD) sensors allowed for the collection of vertical
profiles of temperature and salinity during each ascent to the sea
surface (Loaec et al., 1998; Davis et al., 2001). Early inductive-
type CTDs used on floats did not perform reliably, but the first
pumped ele ct rode-type CTD, a prototype supplied by Sea-Bird
Scientific (used on Float 063, with WMO ID
2
41862, deployed
by the University of Washington in 1997), demonstrated that
an accuracy of 0.01 in Practical Salinity Scale 1978 (PSS-78) was
obtainable for float salinity over the course of several years (
Argo
Science Team, 1998).
As Argo developed, early float models used in WOCE were
augmented by newer ones. As a result, a variety of float types have
been used in Argo. These include:
• the PROVOR and the ARVOR, designed by Ifremer and built
by nke Instrumentation
• the APEX, built by Teledyne Webb Research
• the SOLO-I and the SOLO-II, built by
3
Scripps Institution
of Oceanography
• the S2A, a commercial version of SOLO-II, built by
MRV Systems
• the NAVIS, built by Sea-Bird Scientific
• the NOVA, built by MetOcean
• the NINJA, built by Tsurumi-Seiki
Table 1 shows the percentage of profiles that each of these float
types has obtained.
CTD Units and Pre-deployment Sensor
Checks
The CTD units fitted to most Argo floats have been manufactured
by two companies, Sea-Bird Scientific (SBE) and Falmouth
Scientific (FSI). The FSI unit was an inductive-style sensor and
was only used in a small number of floats (about 3% as of 2019) in
the beginning of the program. The SBE CTD unit is an enclosed
pump unit (Figure 2) and has been used on almost all Argo
floats since 2005. The details of the operation of the SBE CTD
unit are descri bed in
Riser et al. (2008) and Riser et al. (2018).
Briefly, the CTD pump draws seawater through the intake past
the temperature sensor and then through the conductivity cell.
Fluid in the cell exits through an exhaust port that is aligned
perpendicular to the intake, so as not to contaminate the water
entering the cell. The pressure sensor is mounted on the float
end cap, close to the CTD unit. The temperature and electrical
conductivity of the seawater sample in the cell are measured
1
Despite having depth in the name, all CTDs actually measure pressure.
2
WMO ID is the World Meteorological Organization identification number.
3
Woods Hole Oceanographic Institution also built the SOLO-I fl oats up until
about 2012. These are designated as SOLO-W.
Frontiers in Marine Science | www.frontiersin.org 3 September 2020 | Volume 7 | Article 700
Wong et al. Argo Data 1999–2019
FIGURE 1 | A schematic illustration of the standard Argo “park-and-profile” mission. The surface interval of ∼20 min is applicable to floats that use Iridium satellite
communication; floats that use ARGOS satellite communication require surface interval of several hours for data telemetry. [Source: Woods Hole Oceanographic
Institution].
TABLE 1 | The various float types and their primary vertical sampling schemes as
a percentage of the total number of primary profiles in Argo, as of April 2019.
Primary
vertical
sampling
scheme
Float
type
Discrete
mode
Bin-averaged
continuous
mode
Mixed
mode
APEX 46% 6% 7%
PROVOR/ARVOR <1% 15% –
SOLO-I/SOLO-II/S2A <1% 19% <1%
NAVIS <1% 4% <1%
NEMO <1% <1% –
NOVA <1% <1% –
NINJA <1% – <1%
TOTAL 47% 45% 8%
directly. From temperature, pressure, and conductivity, salinity
(in PSS-78) can be computed by using the equation of state for
seawater (
Fofonoff and Millard, 1983).
Sea-Bird Scientific has supplied two main CTD models for
Argo floats: the SBE-41 and the SBE-41CP. The SBE-41 operates
in the spot-sampling mode only a nd collects discrete samples
according to a pre-set pressure table, with th e CTD pump turned
off between samples. The SBE-41CP has the capability to operate
in both the spot-sampling mode and the continuous-profiling
(CP) mode. When used in the CP mode, the CTD pump remains
on and samples are collected at nominally 1 Hz. These continuous
data are then bin-averaged onboard the float before they are
transmitted by satellite.
The manufacturer-quoted initial accuracies for the SBE-
41/41CP, as of 2019, are 2 dbar for pressure
4
, 0.002
◦
C for
temperature, and 0.0035 PSS-78 for salinity. Some float-
providing groups conduct independent CTD accuracy checks to
ensure that the sensor calibrations are within the manufacturer’s
specifications before float deployment. The Euro-Argo group
performs systematic tests of profiling floats in Ifremer’s 20 m-
depth seawater pool. Floats are tested simultaneously in batches
of 10–40, and multiple test cycles (typically 6) are conducted over
a 3-day period. The 20 m-depth profiles and park-phase data
at pool depth are compared at sensor resolution level. As the
test pool is a stable seawater environment, float sensors whose
4
The pressure accuracy specification for the SBE-41/41CP was changed from 2.4
dbar to 2 dbar in 2011 by Sea-Bird Scientific.
Frontiers in Marine Science | www.frontiersin.org 4 September 2020 | Volume 7 | Article 700


- 1
- 2
- 3
前往页