


Public Imagination Technologies
POWERVR 1 Revision 1.11f
POWERVR
Navigation Rendering Techniques
Copyright © Imagination Technologies Ltd. All Rights Reserved.
This publication contains proprietary information which is subject to change without notice and is
supplied 'as is' without warranty of any kind. Imagination Technologies and the Imagination
Technologies logo are trademarks or registered trademarks of Imagination Technologies Limited.
NAVTEQ and NAVTEQ Network for Developers are trademarks of NAVTEQ in the U.S. and other
countries. All other logos, products, trademarks and registered trademarks are the property of their
respective owners.
Filename : POWERVR.Navigation Rendering Techniques.1.11f.External.doc
Version : 1.11f External Issue (Package: POWERVR SDK 2.08.28.0634)
Issue Date : 07 Feb 2011
Author : Imagination Technologies

Imagination Technologies Public
Revision 1.11f 2 Navigation Rendering Techniques
Contents
1.
Introduction .................................................................................................................................4
1.1.
Point-Of-View Types...........................................................................................................4
1.2.
Sample Data.......................................................................................................................4
2.
Data Organisation.......................................................................................................................5
2.1.
Spatial Hierarchies for Efficient Culling ..............................................................................5
2.2.
Batching Indexed Geometry...............................................................................................6
2.3.
Geometry Triangulation ......................................................................................................7
2.3.1.
Road Triangulation...................................................................................................7
2.3.2.
Intersection Triangulation.........................................................................................9
2.3.3.
Polygon Triangulation.............................................................................................12
2.3.4.
Floating Point Precision..........................................................................................13
3.
Rendering Techniques .............................................................................................................15
3.1.
Adjusting Near and Far Planes.........................................................................................15
3.2.
Anti-Aliased Lines.............................................................................................................16
3.3.
Billboards ..........................................................................................................................18
3.3.1.
CPU Technique ......................................................................................................19
3.3.2.
GPU Technique......................................................................................................20
3.3.3.
Billboard Arrays......................................................................................................21
3.4.
Texture Atlases.................................................................................................................22
3.5.
Outlines.............................................................................................................................25
4.
Tools...........................................................................................................................................27
4.1.
Conversion Workflow........................................................................................................27
4.2.
IntermediateFormatConverter ..........................................................................................28
4.3.
NavDataCompiler .............................................................................................................28
4.4.
libPVRNavigation..............................................................................................................29
4.5.
FontConverter...................................................................................................................29
4.6.
LayerMerger .....................................................................................................................29
5.
Reference Material & Contact Details.....................................................................................30
List of Figures
Figure 1 Quadtree used for hierarchical culling ......................................................................................5
Figure 2 Culling scheme applied to streets layer....................................................................................6
Figure 3 Map blocks containing index data (left: sketch, right: debug view) ..........................................7
Figure 4 Vector calculus used to triangulate line string ..........................................................................8
Figure 5 Gap between two triangulated line segments (left) and the stitched version (right).................8
Figure 6 Tessellated road segments to prevent sharp bends.................................................................9
Figure 7 Overlapping road segments (left) and triangulated intersection (right) ....................................9
Figure 8 Intersection geometry adjustment steps.................................................................................10
Figure 9 Adjusted intersection with hole (left) and stitched (right)........................................................11
Figure 10 Artefact example: Too near adjacent intersections ..............................................................11
Figure 11 Polygon with numbered vertices...........................................................................................12
Figure 12 Polygon with a hole (left) and self-intersection (right)...........................................................12
Figure 13 Polygon triangulation with the ear-clipping technique ..........................................................13
Figure 14 View frustum intersections with ground plane ......................................................................15
Figure 15 Bounding circle with slight shift.............................................................................................16
Figure 16 Comparison of rendering with anti-aliasing disabled (left) and enabled (right) ....................16
Figure 17 Texture aliasing: linear filtering (left) and linear filtering with MIP mapping (right)...............17

Public Imagination Technologies
POWERVR 3 Revision 1.11f
Figure 18 Single channel alpha map (left, added blue border for visibility) and applied onto a road
texture (right).........................................................................................................................................17
Figure 19 Several mip-map levels of the translucency texture.............................................................18
Figure 20 Screen space aligned and perspective text..........................................................................18
Figure 21 Camera coordinate system and spanned rectangle.............................................................19
Figure 22 Highlighted columns corresponding to camera vectors........................................................19
Figure 23 Multiple billboards aligned to build a string...........................................................................21
Figure 24 Illustration of occasional problems when rendering text as billboards .................................21
Figure 25 Billboard array before and after rotation ...............................................................................22
Figure 26 Global and local pivots illustrated .........................................................................................22
Figure 27 Rendering a batch of glyphs without texture atlas................................................................23
Figure 28 Rendering a batch of glyphs with a texture atlas..................................................................23
Figure 29 Simple texture atlas layout example with texture coordinate mapping calculation ..............24
Figure 30 Mip-map chain of power-of-two aligned textures (left) and non-power-of-two aligned
textures (right) .......................................................................................................................................24
Figure 31 Map examples with disabled (left) and enabled (right) outlines ...........................................25
Figure 32 Texture containing outlines for anti-aliased lines technique.................................................25
Figure 33 Adding a rounded cap to the end of a road ..........................................................................26
Figure 34 Data compilation workflow ....................................................................................................27
Figure 35 Overview of input to the navigation demo ............................................................................28

Imagination Technologies Public
Revision 1.11f 4 Navigation Rendering Techniques
1. Introduction
Visualization of navigation data is a complex task: the graphics should be appealing, informative,
running at a high framerate and utilizing low power consumption at the same time. This whitepaper
deals with the efficient rendering of navigation maps on the tile-based deferred rendering architecture
of the POWERVR® MBX/SGX chipset families.
The navigation demo, which can be found in the POWERVR SDK, implements the optimisation
techniques described in the following sections. Particular attention was given to the various
restrictions found in navigation systems in respect to memory constraints, paging, etc.
The geometry generation techniques described in the first few sections illustrate a possible approach;
there might be other, more suitable solutions depending on the input data.
For further reading and a more comprehensive overview please have a look at the documents which
can be found in the POWERVR SDK (see section 4). It is highly recommended to read the application
development recommendation whitepapers to gain a good understanding of performance pitfalls and
general purpose optimisations when developing for mobile graphics solutions.
1.1. Point-Of-View Types
There are several high-level approaches to render a navigation system. They mainly differ in the point
of view and the amount of detail being rendered. From a different perspective this means they differ in
the minimum hardware specs they require from the targeted device to be able to run at an appealing
framerate. The point-of-views covered in this document are:
• 2D top-down: the standard perspective found in a lot of navigation devices from a bird’s eye
view. It features a very limited field of view, concentrating on basic features like streets, signs
and landmarks and can be rendered using an orthographic projection scheme.
The terrain and all the landmarks are specified in a single plane.
• 2.5D: this perspective shares the same set of features with the plain 2D one, but the camera
is slightly tilted to offer a wider field of view. Due to the viewing angle and the perspective
projection, artefacts like line-aliasing have to be considered. Furthermore it is desirable to add
3D models of important buildings to provide reference points for the user.
As with the previous view all the landmarks are specified in a single plane.
• 3D: this view is similar to the 2.5D view, but now all coordinates have an additional z-
coordinate which makes it possible to illustrate additional landscape features like elevation.
In addition to the 3D coordinates it is possible to integrate panoramas to augment the scenery
with images and efficiently achieve a higher level of realism.
We are only going to cover 2D and 2.5D in this document.
The following sections explain how to visualize the most common cues like streets, road signs,
landmarks, etc in an efficient manner.
1.2. Sample Data
The sample data used throughout the navigation demo has been taken from NAVTEQ’s set of free
sample data available on the NAVTEQ website. If you want to download sample data please go to the
following webpage of NAVTEQ Network for Developers™ (NN4D):
http://www.nn4d.com/site/global/learn/freesampledata.jsp.
You can find general information about NAVTEQ data and formats here:
http://www.nn4d.com/site/global/learn/nt_map_data_formats/p_map_data_formats.jsp
In particular the Chicago sample set in ArcView™ format was compiled into a binary format, which
was then used for a navigation demo. The following sections are describing the optimisation
techniques used for the demo. Implementations of the algorithms and techniques can be found in the
POWERVR SDK (see section 5) and an explanation of the various navigation data tools used to
convert the sample data can be found in section 4.
Public Imagination Technologies
POWERVR 5 Revision 1.11f
2. Data Organisation
One of the most important aspects of the whole optimisation process is data organisation. It is not
possible to deal with every different hardware configuration in this document, e.g. considering types of
mass storage, display resolution, orientation, etc.; therefore easily adaptable algorithms are presented
instead of specially tailored versions.
The following sections explain approaches to optimize visibility queries through spatial hierarchies, on
how to improve performance by batching geometry and how to triangulate mapping primitives in a
hardware suitable representation.
2.1. Spatial Hierarchies for Efficient Culling
In most cases the best rendering optimisation is to not render something at all, at least if it is not
visible. This can be achieved by culling objects which are outside of the view frustum (visible volume
enclosed by the screen) or covered by other objects. Simply checking each object against the view
frustum is not a good approach though, as the computational complexity increases linearly with the
number of objects. Instead a 2D version of a binary tree search can be applied, commonly known as
quadtree.
A quadtree builds a spatial hierarchy on top of a dataset which speeds up certain operations like
spatial queries. Each node in the quadtree contains either references to geometry or references to
child nodes. If it does not reference any child nodes it is considered to be a leaf node.
A typical spatial search sequence then looks like that:
• Beginning at the root of the tree each child is consecutively checked if its bounding rectangle
intersects the view frustum.
• If a child is not contained all its children are culled at once, vastly pruning the search domain.
• If a child is not a leaf node, repeat the intersection test for each child.
• All intersected leaf nodes can be considered visible and the contained objects rendered.
Basically a quadtree is built recursively, starting with the whole dataset and a bounding box enclosing
it. The bounding box is then subdivided into four bounding boxes, the children, and each object is
assigned to the bounding box it is contained in. This process is repeated until a certain criterion is
met, like a maximum number of recursions or a minimum number of objects left per bounding box.
In some cases it might not be possible to build a spatial hierarchy containing the whole dataset
beforehand, but it should be considered to generate them for the current working set. For example if
you are paging regions of the map during runtime you could dynamically generate them in the
background.
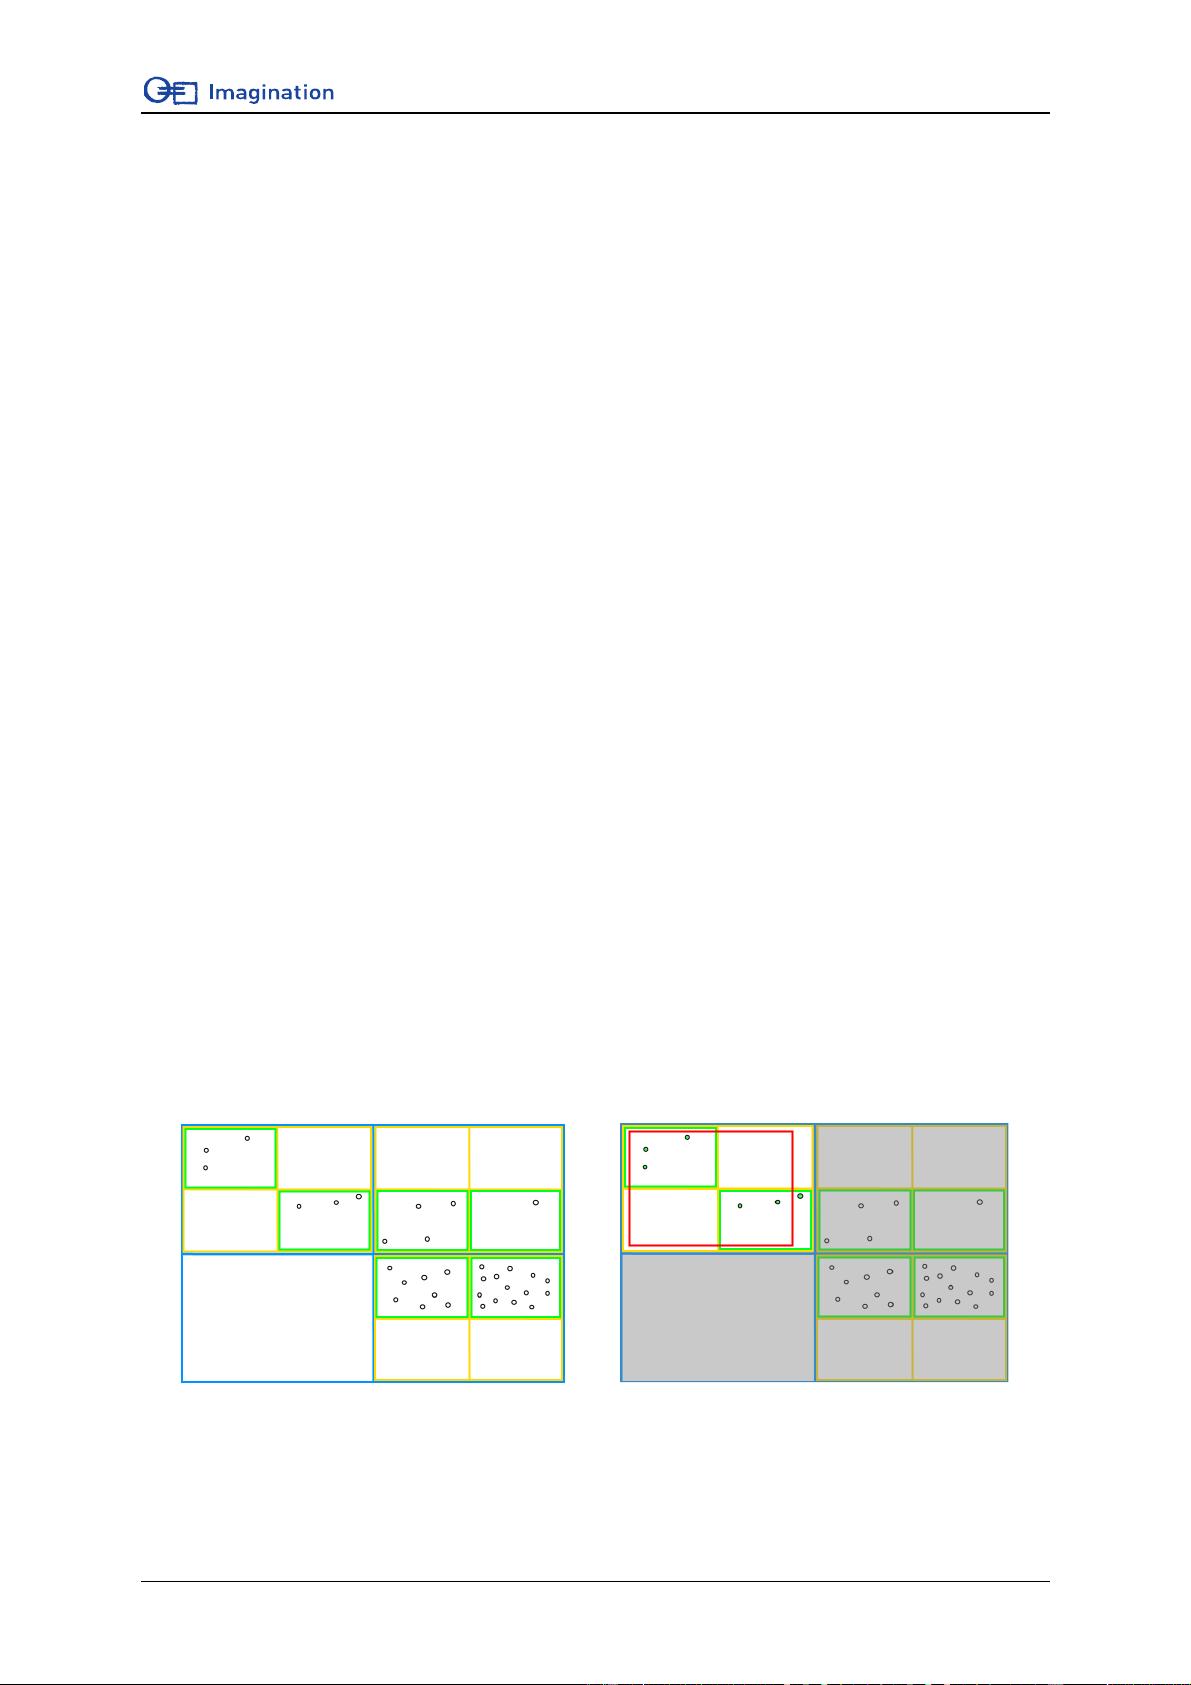
Figure 1 Quadtree used for hierarchical culling
Figure 1 illustrates a simple quadtree containing a set of points. The root node is indicated with blue
lines and all child node levels are coloured differently. The green rectangles are the bounding boxes
for the leaf nodes and contain references to the contained geometry. The image to the right shows the


