没有合适的资源?快使用搜索试试~ 我知道了~
资源推荐
资源详情
资源评论
CP5229: Seeing Data and More: The Analysis
Visualization Framework in the Autodesk® Revit API
Matt Mason – IMAGINiT Technologies
CP5229
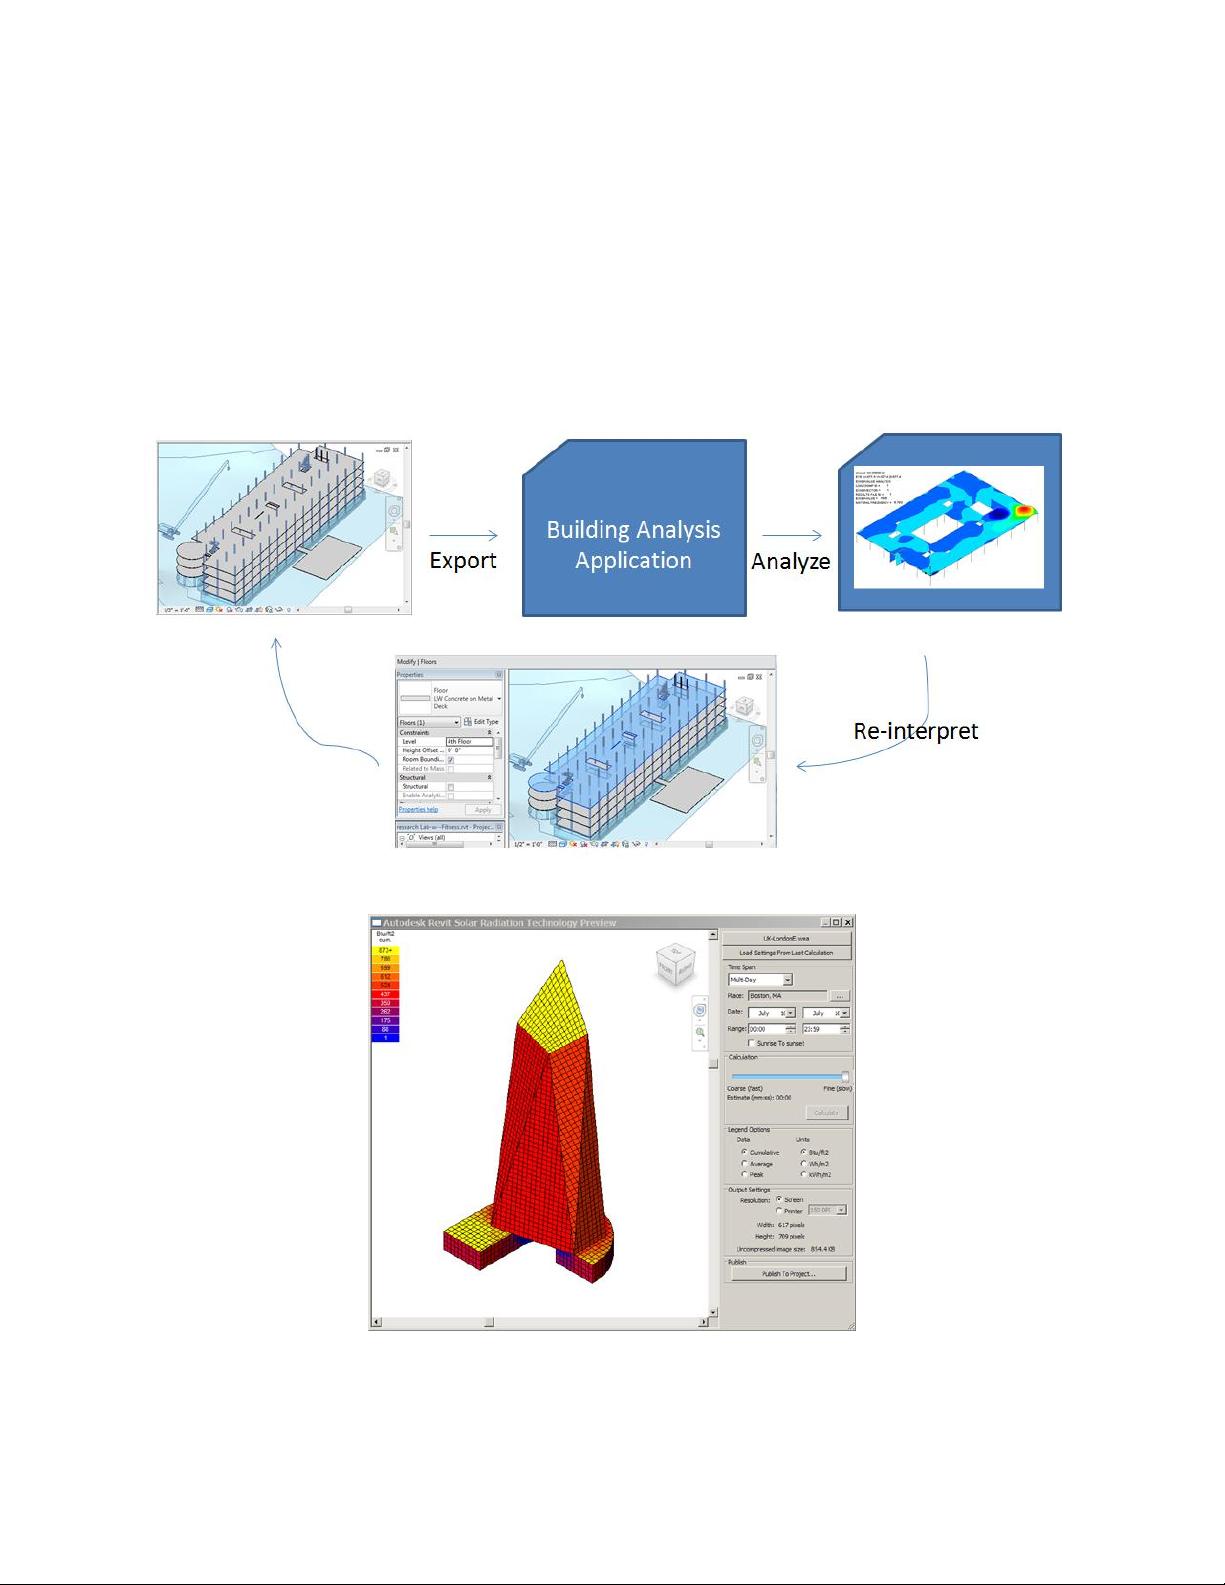
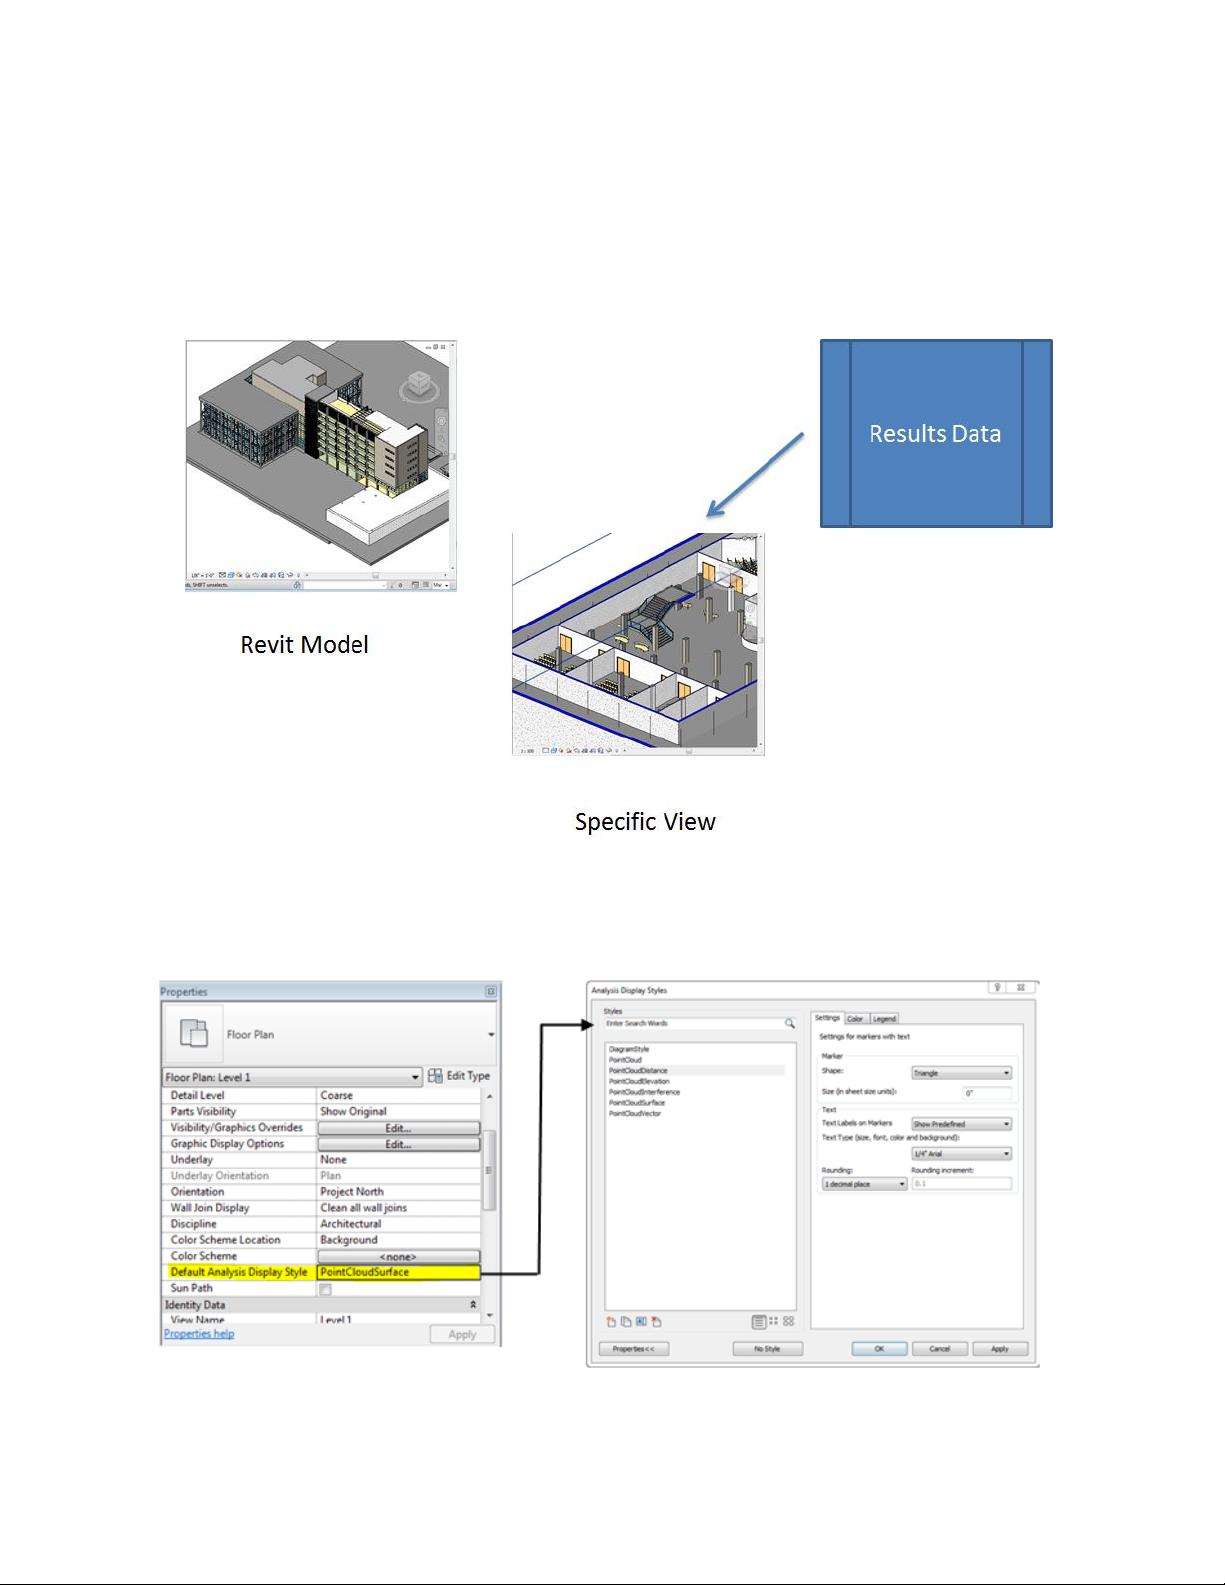
The analysis visualization framework (AVF) is a fantastic new part of the Revit API. Its primary purpose is
to be able to visualize analysis data inside of a Revit project, but you can use it for so much more than
that! You do not need to be an analysis vendor to have this be useful—you just need to want to be able to
show information graphically in Revit. For this class, it is helpful to have basic knowledge of the Revit API.
Learning Objectives
At the end of this class, you will be able to:
Understand what the AVF is and what it can do
Understand the kinds of visualizations you can make in Revit
Create temporary geometric elements to help with visualizing
Create a variety of data visualizations
Understand the limitations of AVF
About the Speaker
Matt is the director of software development at IMAGINiT Technologies. He has been working
on software development in the CAD and PDM world for 20 years. He has worked on both
packaged software and company-specific software in manufacturing, facilities management,
and architecture firms. Matt holds a BSE in aerospace engineering from University of Michigan.
E-mail: mmason@rand.com
CP5229: Seeing Data and More: The Analysis Visualization Framework in the Autodesk® Revit® API
2
What is the Analysis Visualization Framework (AVF)?
The Analysis Visualization Framework is a part of the Revit API devoted to being able to show
the results of technical analysis inside of the Revit environment. It was introduced in Revit 2011
and enhanced in 2012. The framework came about because the traditional workflow of looking
at analysis results (and perhaps making changes based on them) was not very good.
Traditional Workflow:
New Workflow:
But what is the AVF, practically?
Practically, the AVF is a series of APIs which enable you to:
CP5229: Seeing Data and More: The Analysis Visualization Framework in the Autodesk® Revit® API
3
- Draw color graphics on the screen in a Revit Project
- Graphics are of different styles, depending on what you choose and the data you’re
trying to show.
- Graphics are NOT residents of the database – so they don’t add to the size of the Revit
model (and they don’t persist – if you want them again later you need to re-make them).
What types of graphics can be created?
There are four types of analysis display styles that can be used:
- Colored Surface
- Markers (w/ optional text values)
- Diagram (w/ optional text values) *
- Vectors (w/ optional text values) *
* only available in Revit 2012 products
What are normal uses?
Normal uses of the AVF include visualizing data like:
- Lighting
- Energy
- Structural analysis
- Airflow
- Temperature
What about unusual uses?
Much of this presentation will revolve around unusual uses for the AVF (since most of us do not
work for analysis software companies). Ideas for this include:
- Point Cloud rendering
- Point Cloud deviation from model
- Visualizing Geometry
- Temporary Vectors (curvature, grids, etc.)
- And more…
CP5229: Seeing Data and More: The Analysis Visualization Framework in the Autodesk® Revit® API
4
Technical Overview (Inside Revit)
Inside Revit, there are a variety of ways that you interact with AVF as a user.
Each view has a property for the default analysis display style. This controls how the data is
displayed within the view. The Analysis Display Styles are elements within the model that can
be applied to any view.
剩余17页未读,继续阅读
资源评论
硬核小青年
- 粉丝: 706
- 资源: 22
上传资源 快速赚钱
- 我的内容管理 展开
- 我的资源 快来上传第一个资源
- 我的收益 登录查看自己的收益
- 我的积分 登录查看自己的积分
- 我的C币 登录后查看C币余额
- 我的收藏
- 我的下载
- 下载帮助
安全验证
文档复制为VIP权益,开通VIP直接复制
信息提交成功