软件开发成本估计方法--英文


Annals of Software Engineering 10 (2000) 177–205 177
Software development cost estimation approaches –
A survey
Barry Boehm
a
, Chris Abts
a
and Sunita Chulani
b
a
University of Southern California, Los Angeles, CA 90089-0781, USA
b
IBM Research, 650 Harry Road, San Jose, CA 95120, USA
E-mail: sunita@us.ibm.com
This paper summarizes several classes of software cost estimation models and techniques:
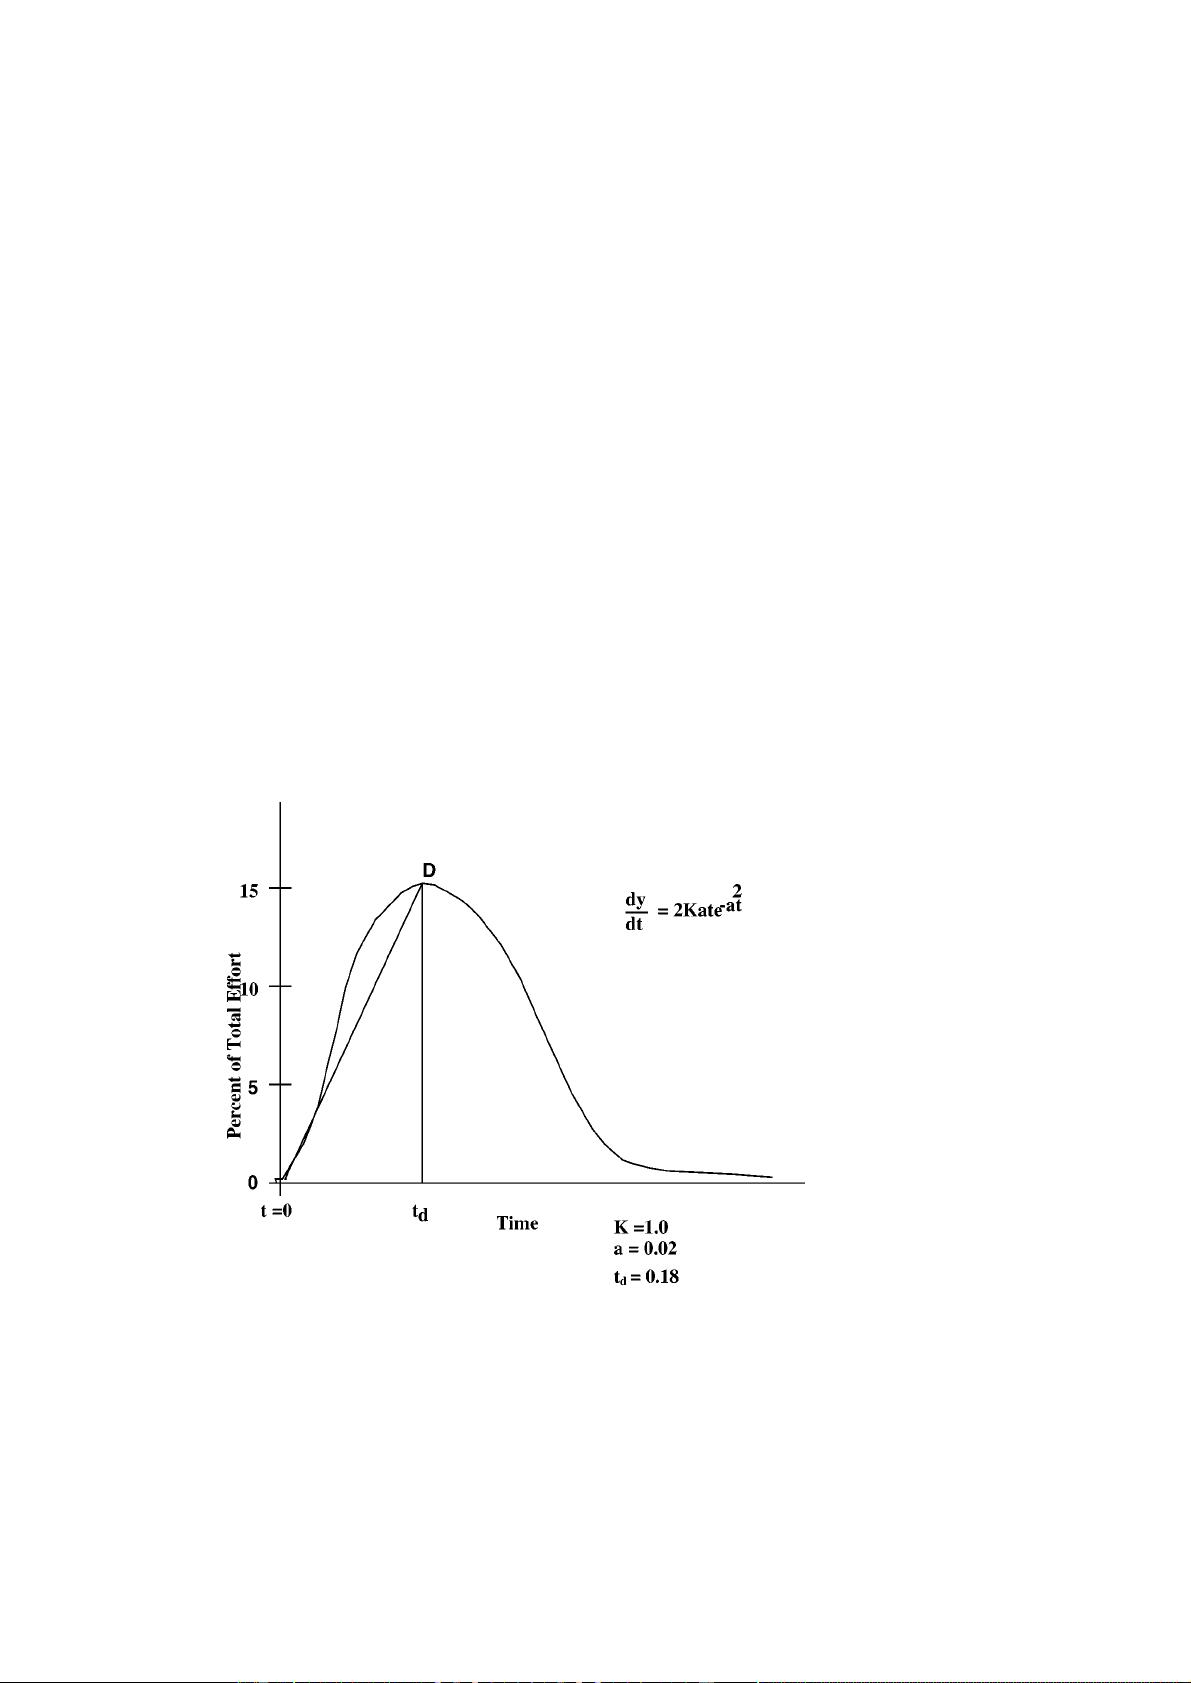
parametric models, expertise-based techniques, learning-oriented techniques, dynamics-
based models, regression-based models, and composite-Bayesian techniques for integrating
expertise-based and regression-based models. Experience to date indicates that neural-net
and dynamics-based techniques are less mature than the other classes of techniques, but that
all classes of techniques are challenged by the rapid pace of change in software technology.
The primary conclusion is that no single technique is best for all situations, and that a careful
comparison of the results of several approaches is most likely to produce realistic estimates.
1. Introduction
Software engineering cost (and schedule) models and estimation techniques are
used for a number of purposes. These include:
• Budgeting: the primary but not the only important use. Accuracy of the overall
estimate is the most desired capability.
• Tradeoff and risk analysis: an important additional capability is to illuminate the
cost and schedule sensitivities of software project decisions (scoping, staffing, tools,
reuse, etc.).
• Project planning and control: an important additional capability is to provide cost
and schedule breakdowns by component, stage and activity.
• Software improvement investment analysis: an important additional capability is to
estimate the costs as well as the benefits of such strategies as tools, reuse, and
process maturity.
In this paper, we summarize the leading techniques and indicate their relative
strengths for these four purposes.
Significant research on software cost modeling began with the extensive 1965
SDC study of the 104 attributes of 169 software projects [Nelson 1966]. This led to
some useful partial models in the late 1960s and early 1970s.
The late 1970s produced a flowering of more robust models such as SLIM [Put-
nam and Myers 1992], Checkpoint [Jones 1997], PRICE-S [Park 1988], SEER [Jensen
J.C. Baltzer AG, Science Publishers


剩余28页未读,继续阅读
资源评论

 keneblue2013-01-06感觉不是特别值得。可能是我对这个评估 的期望值太高了吧。如果里面能多点例子就好了。
ulwxf2
- 粉丝: 2
- 资源: 10


